
Litecoin is gasping for air.
If you purchased Litecoin a year ago and sold it today, you’d be down by $2. If you sold it at the close of the year, you’d be at a loss of over $25. If you sold it on 22 June 2019, you’d take home a profit of $86. Such is the fickle market of the digital silver.
Based on the above scenario(s), whichever one you might have ended up with, the Litecoin markets in 2019 have been a rollercoaster. And by rollercoaster, I mean, a literal rollercoaster. Starting off with a steady but exciting run at under $35 when 2019 began, the altcoin soon attracted the eyes of prospective investors as it doubled its value within the first 90 days of the year.
The excitement for LTC enthusiasts was only beginning however. As the rollercoaster began gaining speed, the price, in the period between April and June, surged from $60 to $140, a whopping 133 percent, making it the second highest gainer in the cryptocurrency markets [YTD wise], behind Binance Coin [BNB].
As with every rollercoaster, ‘what goes up, must come down.’ However, no one imagined how steep this descent would be. Since topping out at $143, LTC has shaved over 61 percent of its value since June 2019, and what’s worse is that the ride isn’t about to end just yet.
BROKEN NECK
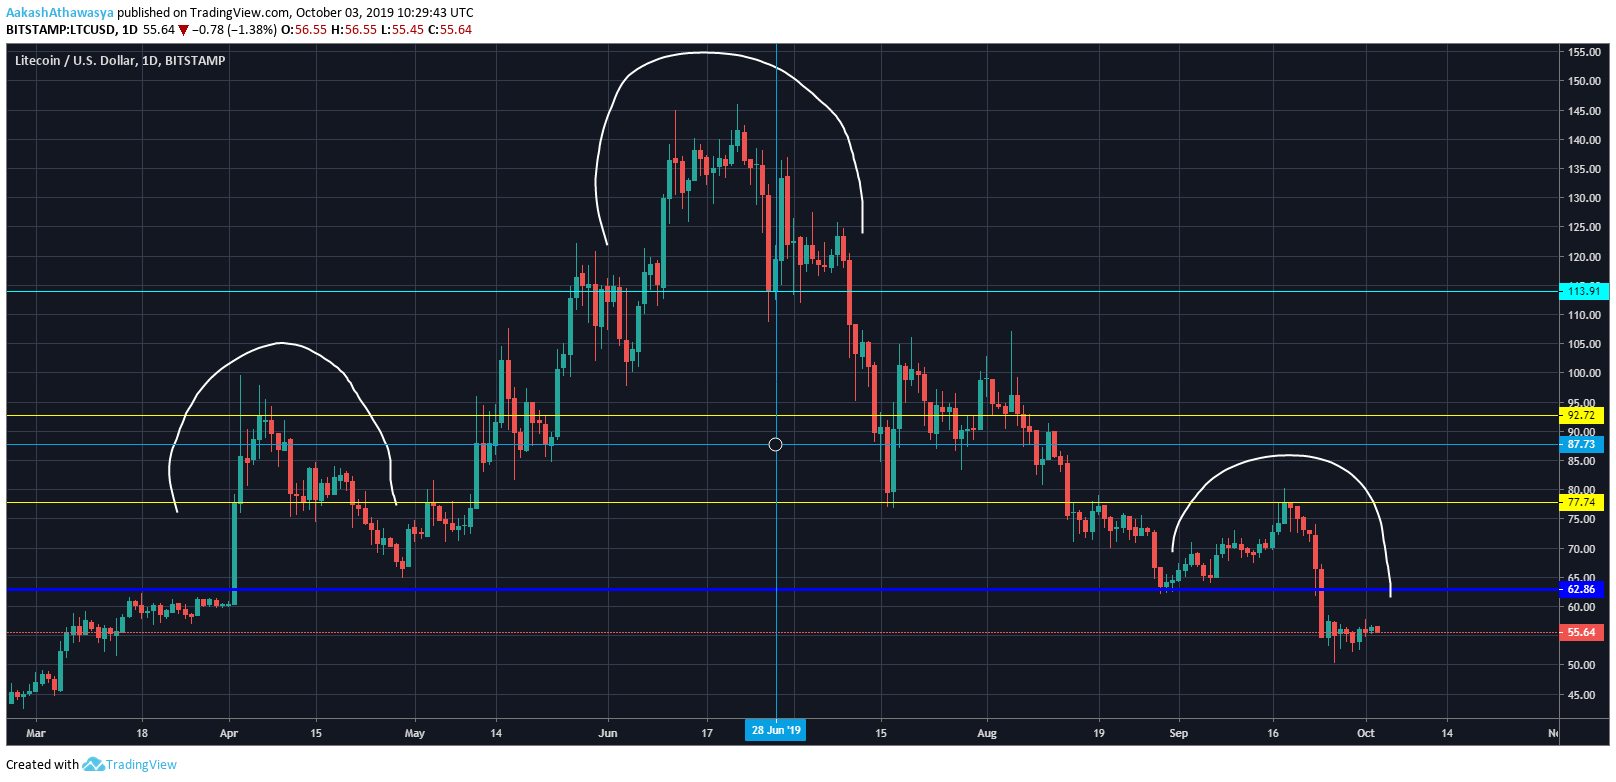
Source: TradingView
The unique case of an alternate between ascent and descent, curated the case for a head and shoulders pattern on Litecoin’s daily chart.
As Bitcoin soared in early April, so did its silver counterpart, leading to the formation of the first shoulder pattern, peaking at a resistance level of $92.72. What followed was an immediate correction and by the close of April, the bull-run was reignited. This run persisted, taking the coin all the way to its peak of $143, the crown of its head.
Things took a stark turn from then on, to say the least. During the period of 18 July to 7 August, the price traded between the channel of $82-$100, and its eventual collapse led to the inklings of the right shoulder, but the decline beginning on 5 August wrote it off.
In early September, the Litecoin markets began gaining momentum, taking the price from the neckline of $62 to the resistance level placed at $72.44, forming half of the right shoulder. The remaining portion of the same began forming on 19 September, and was only propelled by Bitcoin’s massive collapse on 23 September. Within the period of 19 September to 24 September, the price dropped from $77 to $54.
Litecoin, in this ordeal, broke past the neckline placed at $62.86, and at press time, was trading at $55.73 or 11.22 percent below the neckline. Perched on the right-edge of the head and shoulders pattern, the way the markets are going, Litecoin is likely to receive a cold shoulder from the bulls.
HANGING BY A THREAD
At this point, the bears are in too deep, and have too strong of a hold on the Litecoin market to let go. The breach of the neckline, which has been persisting since April, is a key indicator of imminent bearish tendencies for the coin. While the long-term charts do not point to an immediate support level below [the closest one is at $22], the psychological indicator of $50 and a short-term support of $53.77 will be tested in the next few weeks.
Litecoin’s neck has already been broken and if the aforementioned levels are breached, the digital silver will lose its head.