
With the collective digital asset market showing little change over the past week, Ethereum too was victim to the same. Ether value ranged roughly between $565 and $620, maintaining position between the set of resistance and support. Indicative of another bearish turn, we analyzed Ethereum’s long-term chart to figure out its immediate trading range in the coming weeks.
Ethereum 1-day chart
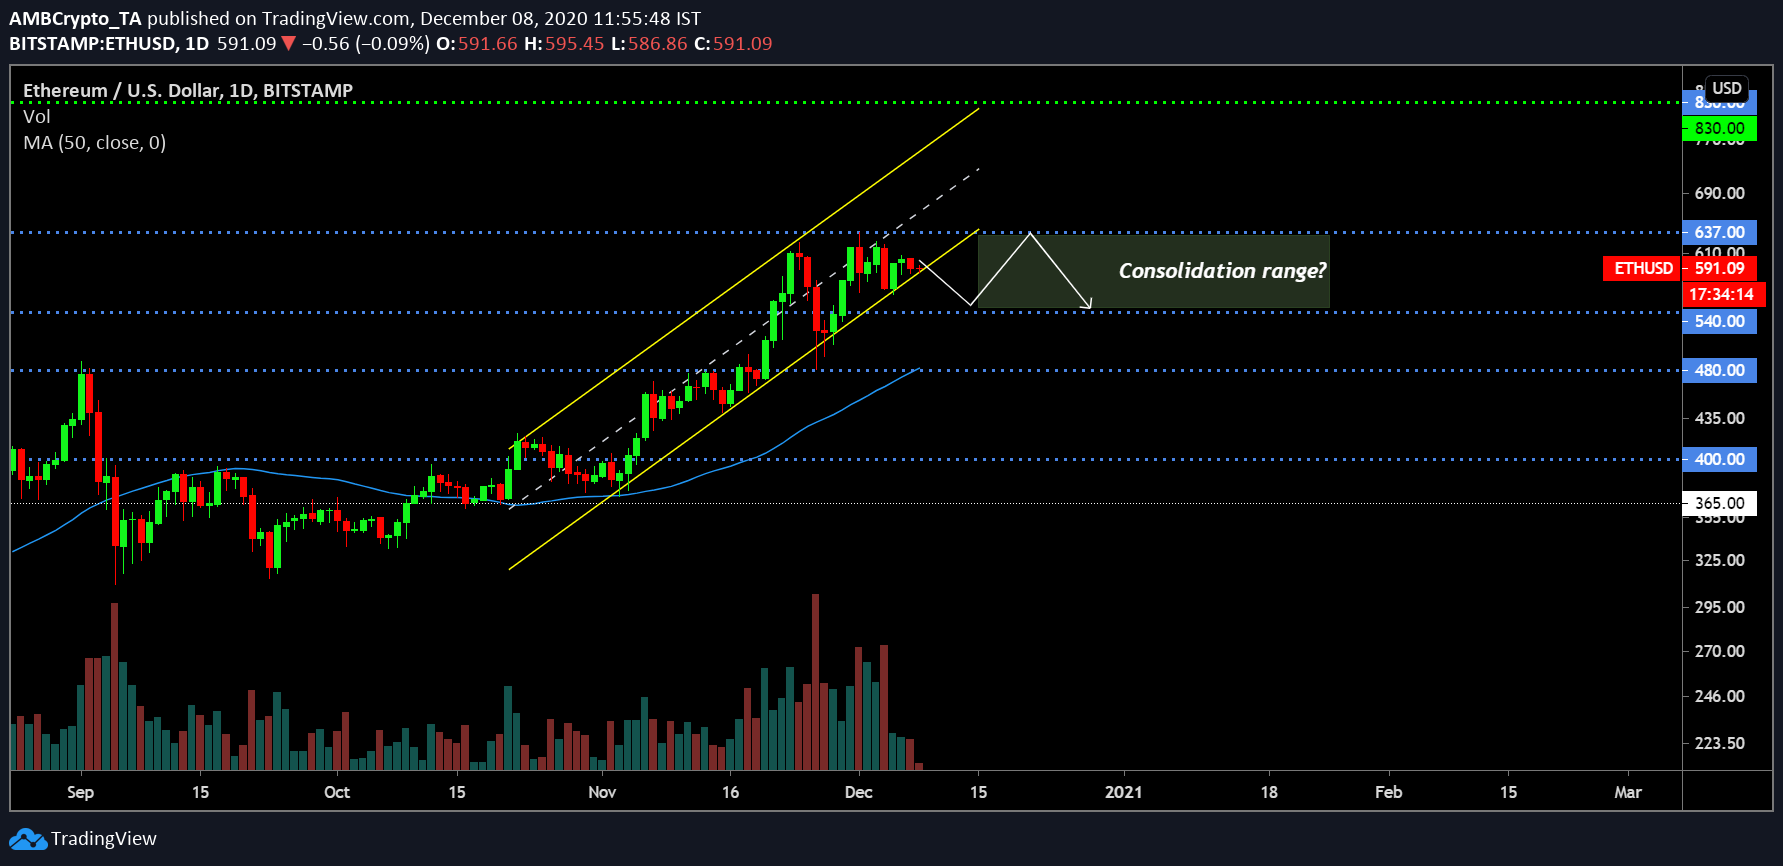
Source: ETH/USD on Trading View
The 1-day chart of Ethereum is indicating an obvious uptick but currently remaining under the trend lines of an ascending channel. Although carrying bearish implications, the pullback might not be as severe as it seemed like earlier last week. With Ethereum, an immediate decline may take the valuation down to $540, which has been its strong support over the past couple of weeks.
Considering the decline takes place, Ether is most likely to maintain a trading range between $637 and $540 till the end of the year. Any change in trend is still possible, but a dry run is the most likely outcome.
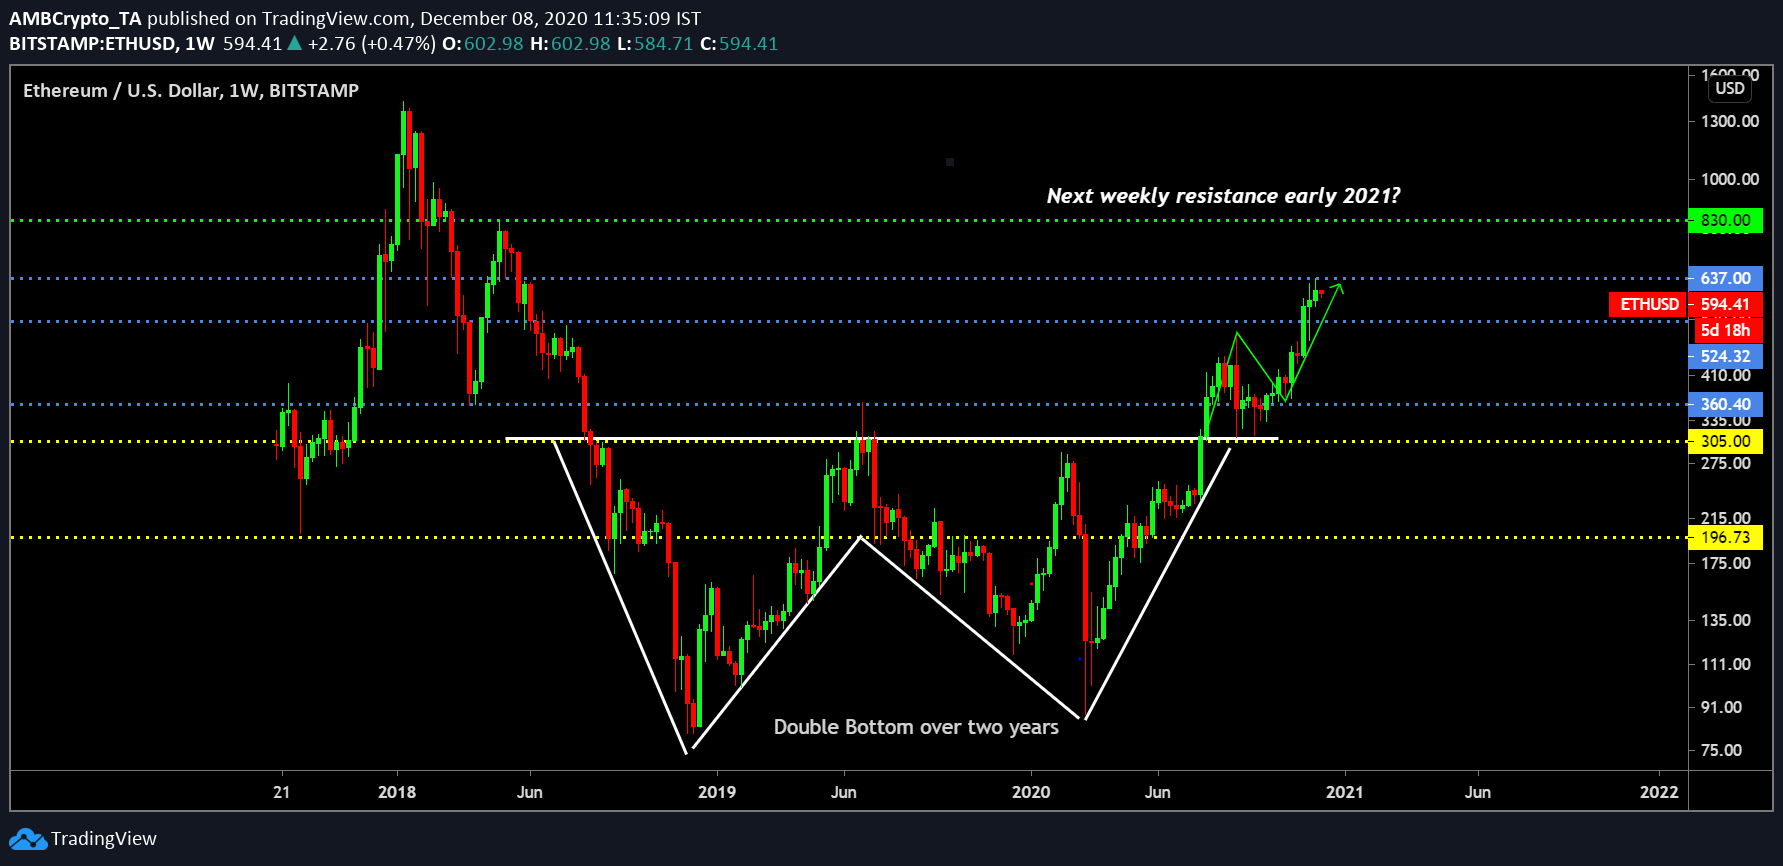
Source: ETH/USD on Trading View
The weekly chart above is also suggestive of decreasing steam in the market. Over the past 2 weeks, the trading range has been small but the double bottom break taking place over the past 2 years, is a good sign in the long-term scenario.
Market Reasoning
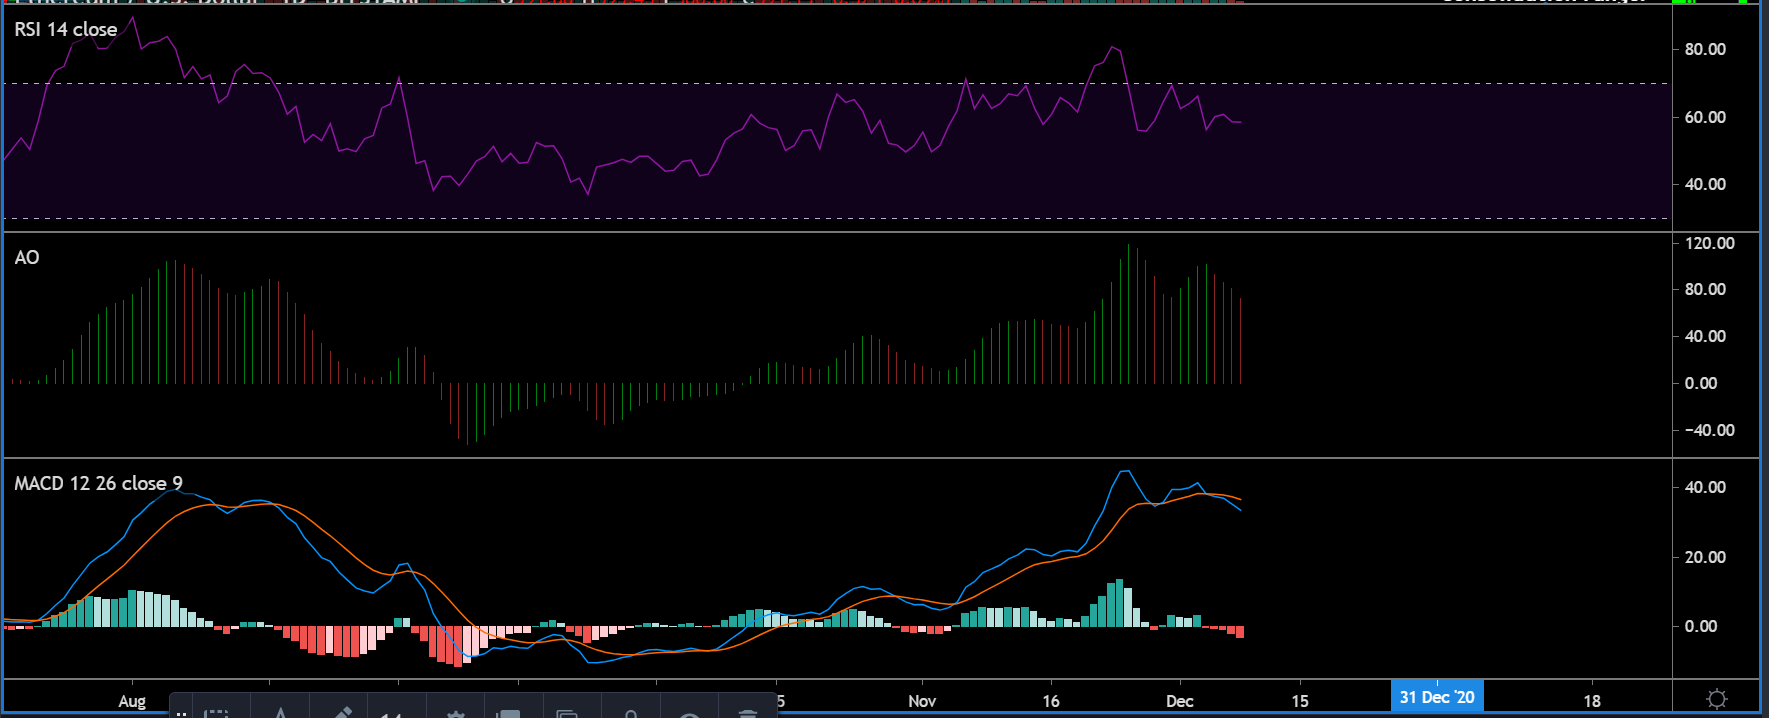
Source: ETH/USD on Trading View
Market Indicators were mostly neutral but slightly bearish as well. Relative Strength Index or RSI is a little bullish in the charts but Awesome Oscillator suggested an increase in bearish momentum.
MACD exhibited a switch towards the bears but as mentioned, the momentum is still low hence not commanding on the price.
Important Range
Resistance: $830, $637
Support: $540, $524
Difficult to call a definite long or short trade.
Conclusion
Last week’s lack of movement might indicate a dry run in the charts at the moment. The valuation should maintain consolidation between $540 and $637 but any spike in momentum for the bulls or bears may change the scenario. At the moment, the trend is widely neutral.