
Litecoin is finally making a move.
As the market for altcoins moved, the charge was led by the top dogs. Ethereum and XRP inevitably stole the spotlight, surging ahead with mammoth gains, but Litecoin was firmly on their tails. Quietly inching into the $70 range, which it had fallen out of last month, the digital silver is now looking healthy.
With bearish signs littered across LTC charts, the move out looked optimistic, to say the least. However, with sustained trading over the $70 mark, coupled with healthy technical signs, the coin could sustain its uptrend.
SHORT TERM
Source: Trading View
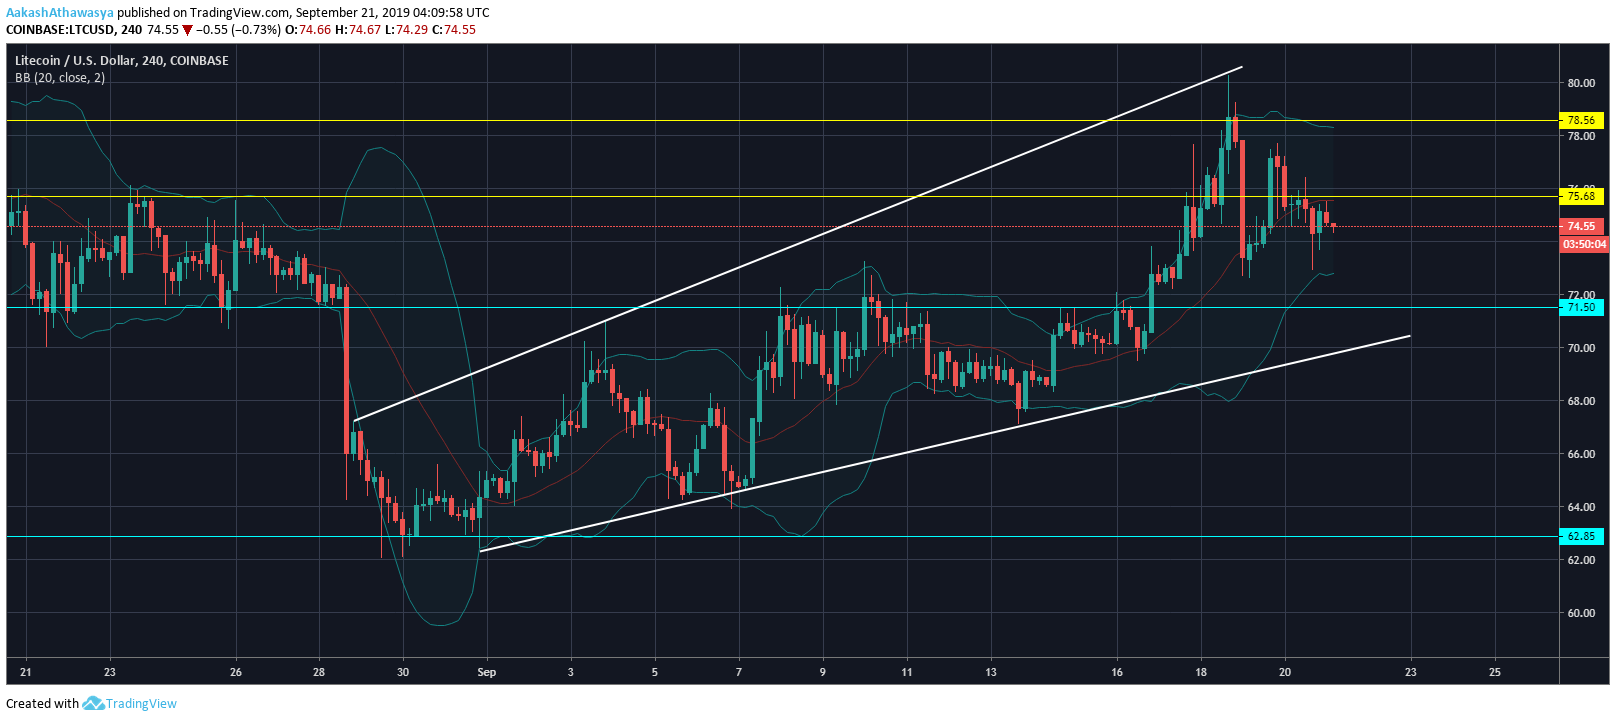
When looking at the cryptocurrency’s 4-hour chart, the parallel channel seems to be widening. With higher-highs being mounted, the coin has broken two key levels. Firstly, the psychological level of $70 was surpassed on 16 September, a precursor to the altcoin upswing. The next resistance level of $75.68 was seen off on 18 September, as the coin surged to $78.5, just short of the $80 mark.
Since then, Litecoin has dropped below the aforementioned levels, trading at $74.75 at press time. However, given the direction of the parallel channel and the movement of the lines away from each other, the spread will look to increase, calling for more wayward movement in LTC’s price, if the markets sustain its current movement. The Bollinger Bands have compounded this movement, addressing the increase in volatility.
LONG TERM
Source: Trading View
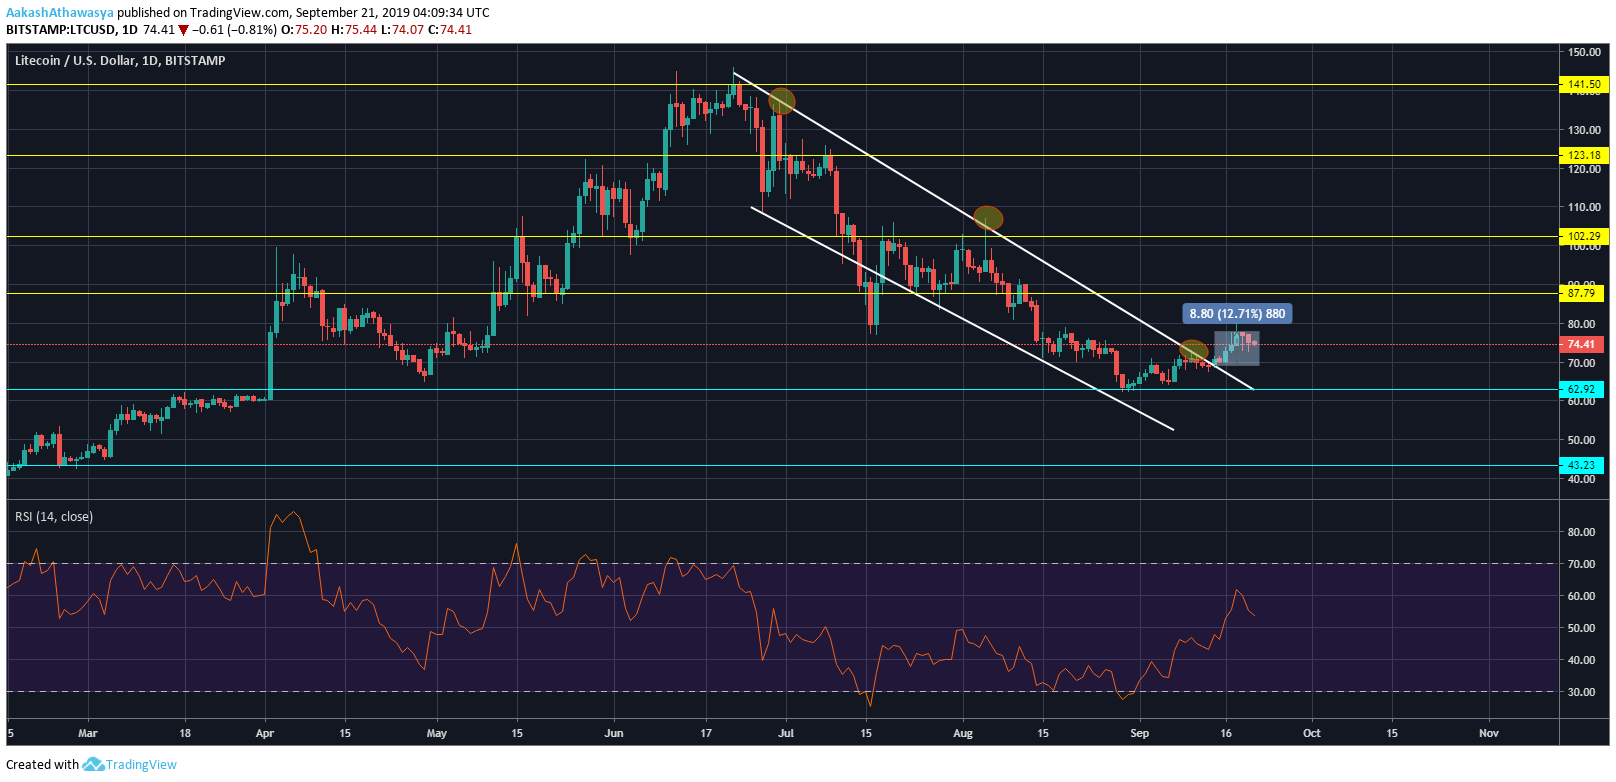
The long-term 1-day chart is where things get really interesting. In stark contrast to the previous chart, the 1-day chart shows Litecoin trading in almost a perfect parallel channel. However, following the proceedings of the past week, a breakout was seen beginning on 14 September.
Within the period of 14 September – 21 September, Litecoin saw a 12.7 percent price increase which pushed the coin out of the parallel channel, signalling a strong recovery. A breakout here could be significant as several resistance levels are seen on the horizon, and if broken, the coin could push above to yet another channel.
The 1-day chart shows support placed at $62.92, while resistance is present at $87.79. Litecoin can be expected to trade between these extremes. The end of the channel is marked at just below $70. Hence, a move below the same could signal a drop back into the parallel channel and can trigger a sell-off.
Volume being the key here, should look to sustain itself. The Relative Strength Index [RSI] is still holding strong, despite an apparent U-Turn from the 62 mark. At press time, the investor interest can be pegged at 53, still positive, but a move below 50 could be bearish for the cryptocurrency.
All in all, Litecoin markets look fairly healthy. The massive move up was not succeeded with a immediate correction, the price is trading within a strong channel, with volatility on a controlled incline, and investor interest still holding strong. Key levels of struggle are placed at $78, which Litecoin bounced off of, and $80 is key at the moment. Fianlly, the channel of $62 – $87 looks to hold.
![Reasons why Litecoin [LTC] investors should be concerned](https://eng.ambcrypto.com/wp-content/uploads/2023/12/ambcrypto_A_Litecoin-themed_scen-400x240.png)