Bitcoin

Litecoin’s descending channel pattern gathers momentum for another breakout but RSI favours a collapse
Posted:

September has been surprisingly exciting for altcoins as many witnessed significant price movement and key resistances were breached in the process. Ethereum is noted to be the top-performing alt at the moment; Litecoin also joined the bandwagon of demonstrating positive growth.
Litecoin hiked from $64.01 on 1st Sept to $79.80 on 18th Sep, registering a growth of 24.66 percent. At press time, Litecoin was valued at $72.11.
1-hour chart
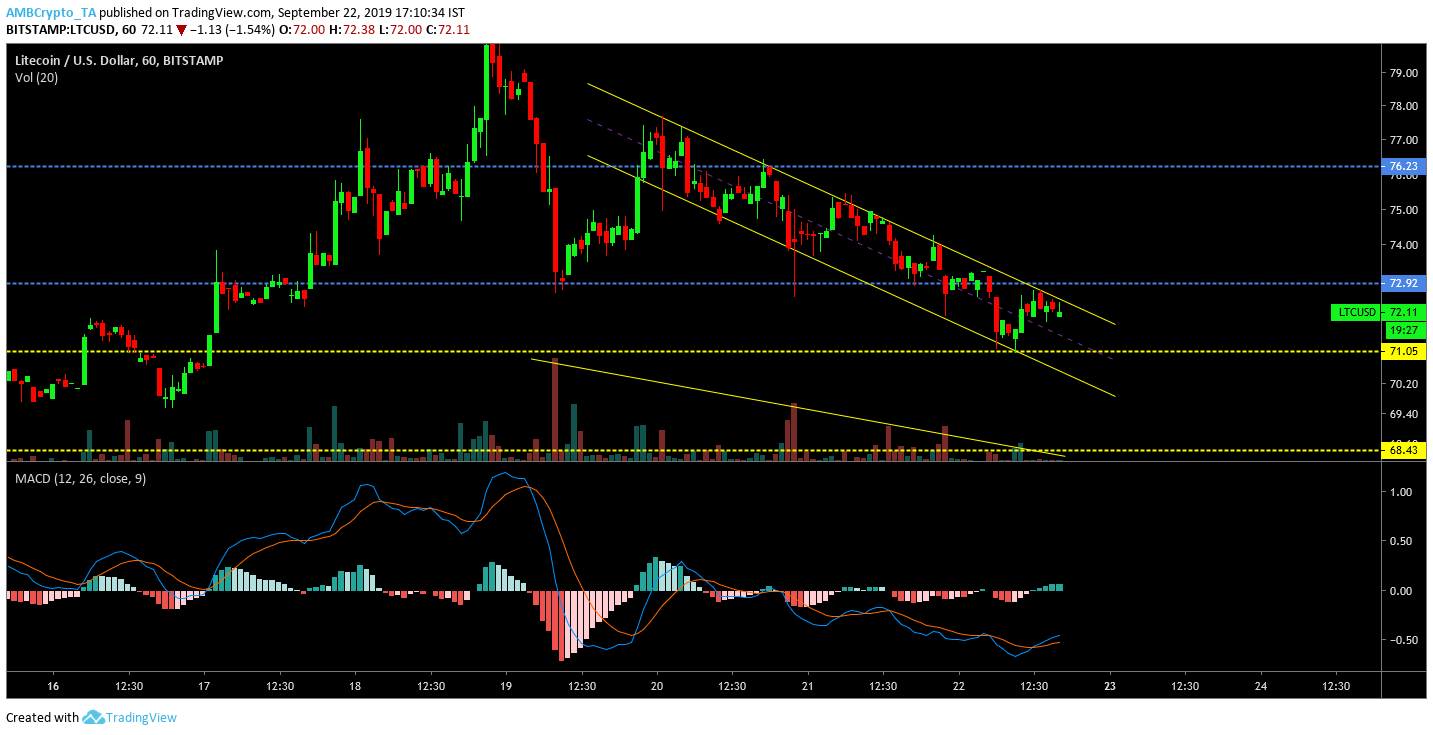
Source: Trading View
1-hour chart for Litecoin exhibited clear signs of bullish movement. On 18th Sept, the virtual asset surged to $79.80 but the steep rise was followed by price corrections. Within 12 hours, LTC depleted to $73.12 but regained momentum to push the price back above resistance at $76.23. Since 19th Sept, the price has progressively declined but the movement gave rise to a descending channel pattern. Channel formation indicated occurrence of another bullish breakout, which should breach the immediate resistance at $72.92 and re-test key resistance at $76.29.The decreasing volume confirmed the validity of the pattern.
MACD indicator also favored LTC’s chances of another bullish breakout as the MACD line hovered over the signal line.
4-hour chart
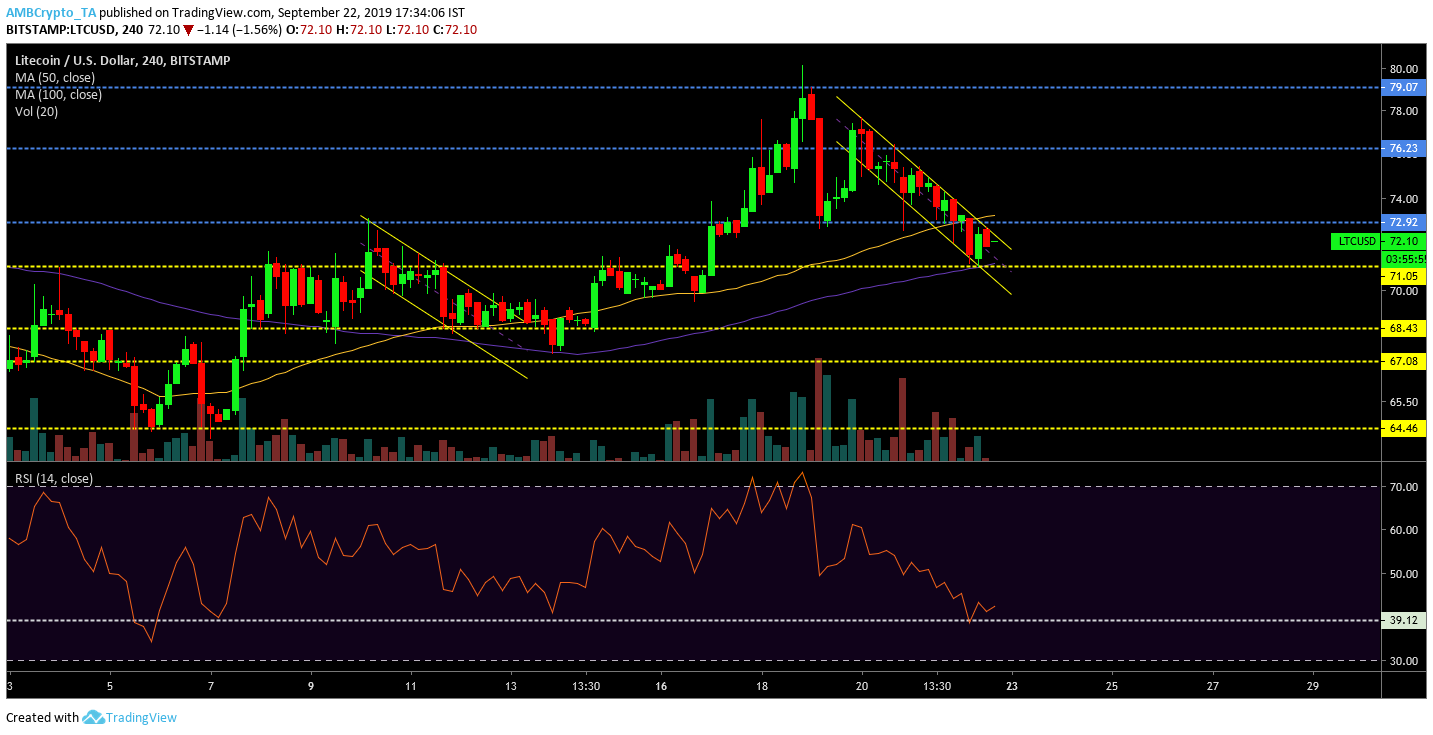
Source: Trading View
4-hour chart of Litecoin revealed more about the trend. Before the current descending channel formation, Litecoin exhibited a similar pattern on 9th Sept, which was successfully broken by a bullish surge. Price hiked by around 15 percent during that time but lacked trading volume. At press time, the current descending channel was backed by high volume which indicated higher involvement of traders in the market. 50-day moving average has been bullish over the past 11 days as the indicator was above 100-moving indicator.
However, Relative Strength Index indicated a closer mediation toward a bearish trend. Litecoin needs to bounce off the 39.12 markers in order to avoid price collapse.
Conclusion
On the short-term, Litecoin should undergo another bullish breakout and re-test resistance at $76.29. The momentum was significant enough at press time but RSI was indicative of a potential price collapse before the imminent breakout.
![Reasons why Litecoin [LTC] investors should be concerned](https://eng.ambcrypto.com/wp-content/uploads/2023/12/ambcrypto_A_Litecoin-themed_scen-400x240.png)