Ethereum in bearish realm despite formation of falling wedge pattern

Last week, the price of several cryptocurrencies was seen plummeting by over 10% following the carnage in the crypto market. Various altcoins were heading towards yearly lows, one of which was Ethereum. The second-largest coin by market cap ETH recorded a yearly low of $165.41. However, the altcoin was headed toward a path of recovery as it was priced at $175.25 during the time of writing.
On CoinMarketCap, the market cap of the coin was $18.93 billion and the price of the coin was rising by 0.43% over the last 24 hours. The 24-hour trading volume of the coin was $5.97 billion where most of it came from the CoinEgg exchange via trading pairs LTC/ETH.
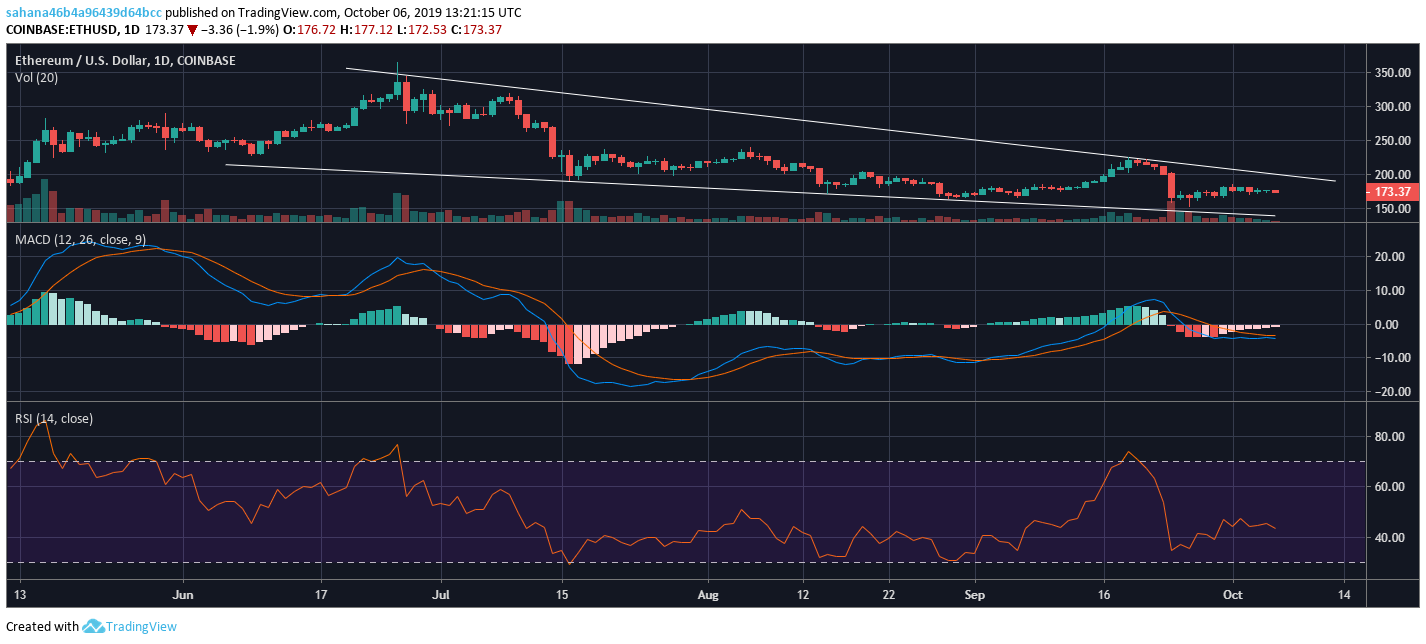
The one day chart for Ethereum indicated a possible breakout in the upward direction however, key indicators hinted the presence of bears in the market.
1-Day Price Chart

Source – Trading View
The one day chart of ETH revealed a downward-sloping trend, further forming a falling wedge pattern. One of the trend lines of the pattern formed lower highs at $345.66, $223.85 and $221.90, while the other trend line exhibited lower lows at $173.74, $172.20 and $164.40. As the wedge extended, the volume was seen deteriorating. As per the pattern formed in the chart, the direction of the breakout might be towards the upward direction.

Source – Trading View
Despite formation of a bullish pattern, the indicators on the one-day chart for Ethereum were seen siding the bears. As per the MACD indicator, the signal line was seen above MACD line indicating a bearish crossover.
RSI indicator was seen fluctuating between the overbought zone and the oversold zone. However, the indicator revealed that ETH was headed toward the oversold zone further implying the presence of bears in the ETH market.
Conclusion
The one-day chart for Ethereum pointed to a falling wedge pattern, further indicating a possible breakout in the upward direction. However, the aforementioned MACD and RSI indicators were exhibiting the strong presence of bears in the ETH market.


