Ethereum, Bitcoin correlation grows stronger as implied volatility retraces

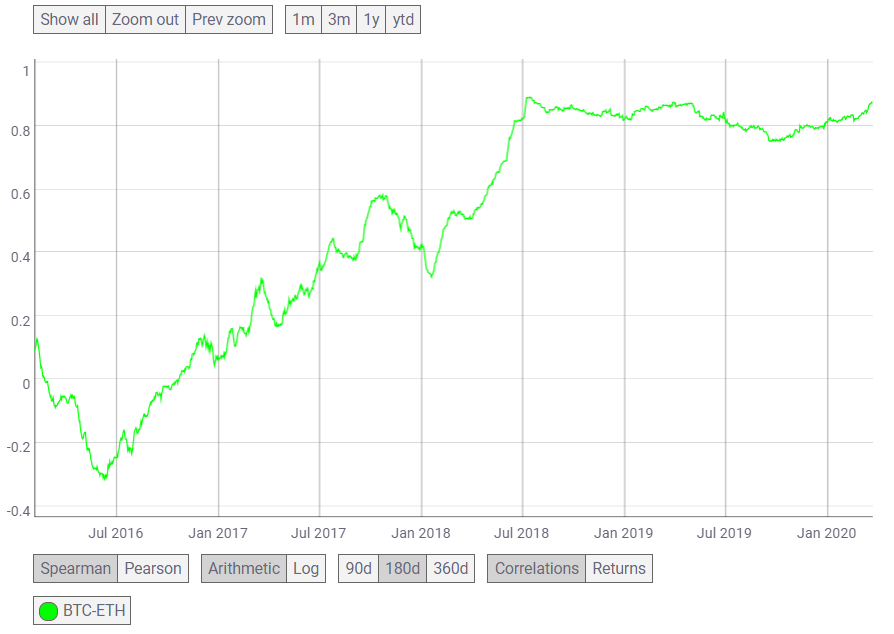
The month of March has been chaotic for most crypto-assets after they faced devaluation, followed by a sudden pump, followed by more prices getting slashed. The world’s largest altcoin, Ethereum, has also been trying to stay away from the market’s bearish sentiment, but has not been successful. However, the correlation between Bitcoin and Ethereum has been moving up and is now close to its previous all-time high in 2018.
The ATH was marked in July 2018 at 0.8893, whereas the correlation value on 22 March 2020 stood at 0.8727, according to data provided by Coin Metrics.

Source: Coin Metrics
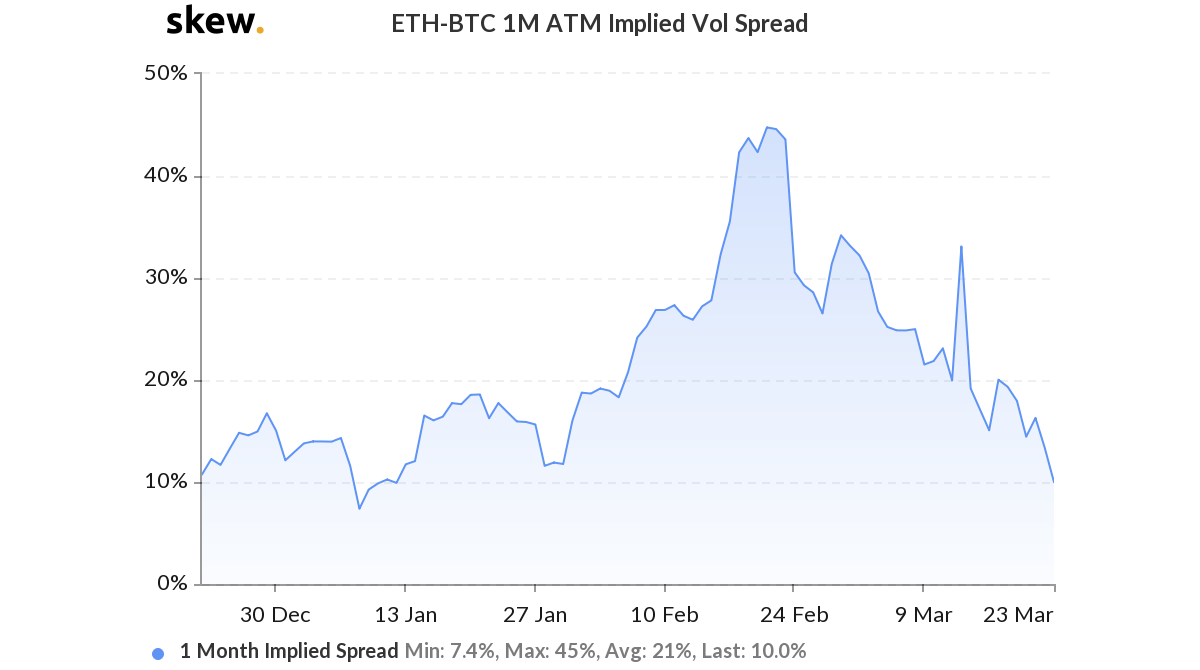
As the correlation grows, the implied volatility for ETH-BTC spread has retraced, according to Skew. The ETH-BTC 1 month ATM spread had noted rising volatility in February, a time when the price of BTC was rising and the alts followed. The peak of this volatile market was noted at 45%, however, the volatility fell after 21 February.

Source: Skew
The implied volatility had noted a spike on 12 March when Bitcoin’s price went down crashing; however, since then, it has been moving downwards. On 23 March, the 1-month ATM Implied volatility of ETH-BTC was at 10%, indicating that the market expected the price of the assets to not move much.
On the other hand, the 1-month Realized Volatility spread indicated that the current ETH-BTC volatility remained at 58%, as Bitcoin noted a sudden pump and dump. The 3-month and 6-month ETH-BTC volatility spreads pointed to the growing volatility between the world’s two largest cryptos.
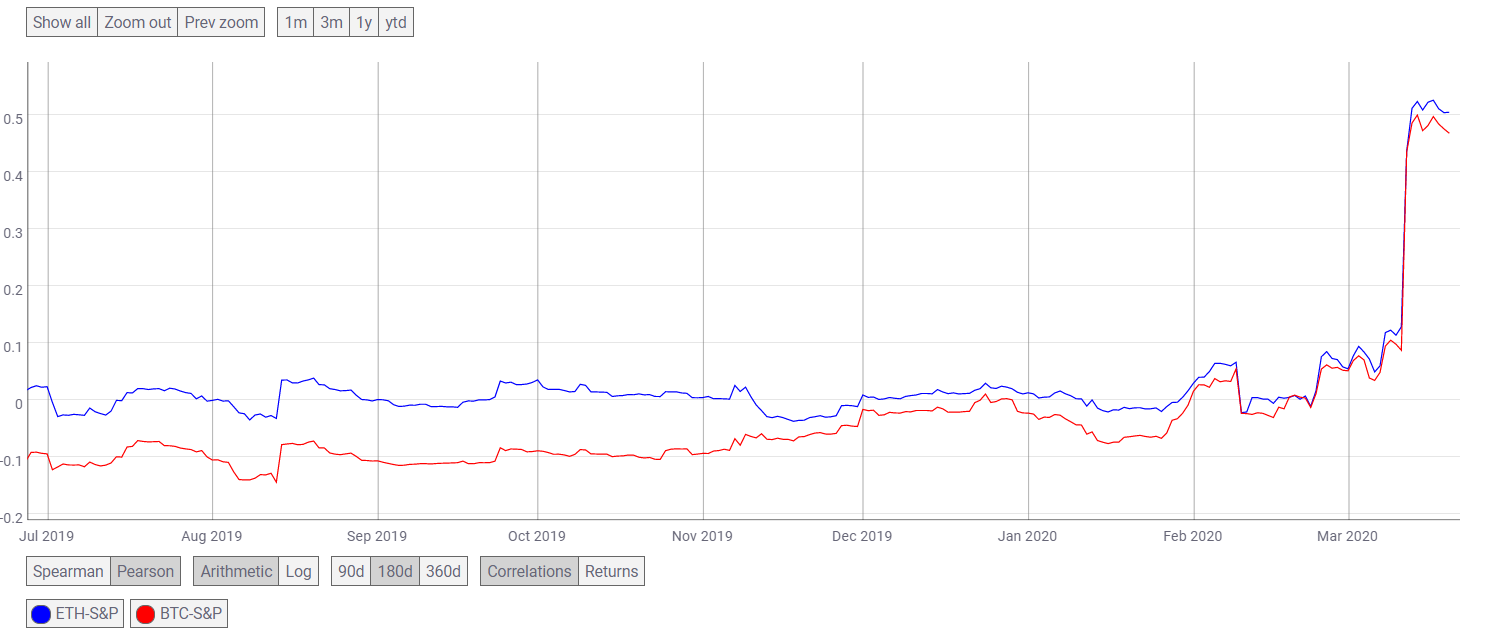
Meanwhile, Ethereum’s correlation has gotten stronger with stocks like S&P. According to Coin Metrics’ data, ETH and S&P’s correlation is higher than that of BTC, at 0.50. While BTC-S&P points downwards, ETH-S&P points upwards.

Source: Coin Metrics
Meanwhile, ETH’s spot price noted a 10.49% rise that boosted its value to $138.13, but the selling pressure overtook the market. At press time, ETH was falling and was being traded at $131.19.

Source: Coinstats


