
If you speak to someone who has heard of Bitcoin but doesn’t invest in it, their reason for the same would probably be something like this, “It’s too volatile for me! I’d rather stick to stocks and bonds.” Well, fair enough, but does it actually hold water?
To answer this, we would have to put a number on the term “volatile.” What would this mean as a percentage of the price? 10 percent? 25 percent? 50 percent? These do seem like very volatile numbers, especially if it’s concentrated within a short timeframe. So, let’s try to understand this ‘volatility’ for Bitcoin in a trading year which has seen the crypto touch a low of $3,800 and a high of $12,200. At face value, that seems very volatile, but once we dive deeper, things seem different.
First, looking at Bitcoin’s price from the beginning of the year up to the beginning of September as a deviation from its price a day prior, there are just 5 instances of a move that was greater than 10 percent of the day’s trading price of Bitcoin. Simply put, this means that for only 5 days in the year, Bitcoin’s price changed by over 10 percent (either higher or lower) in a 24-hour period. 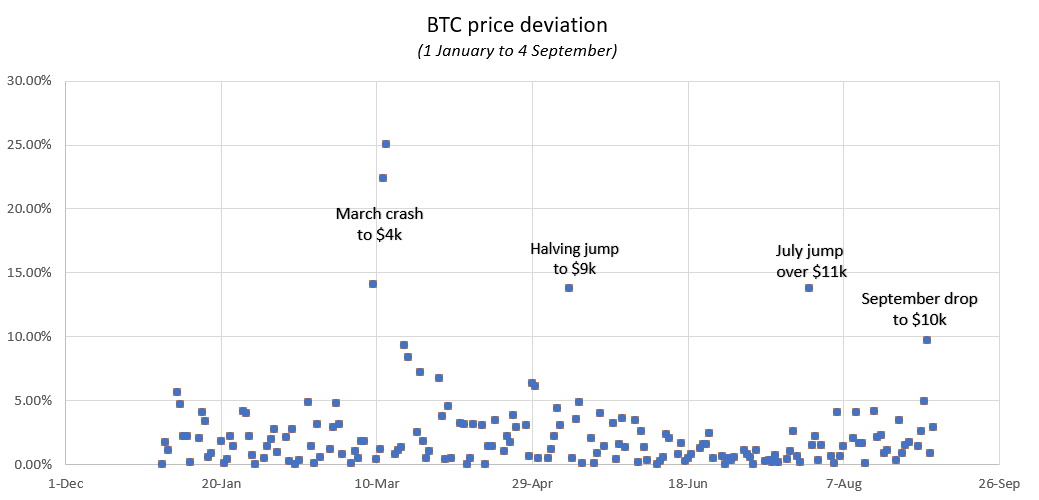 It should be added here that three of the five deviations happened within a short window in March. On 12 March, when Bitcoin dropped to $4,000 from as high as $7,700, the drop, and the subsequent recovery to $5,500 were the two highest deviations all year – 22.3 percent on 12 March and 25.1 percent on 13 March.
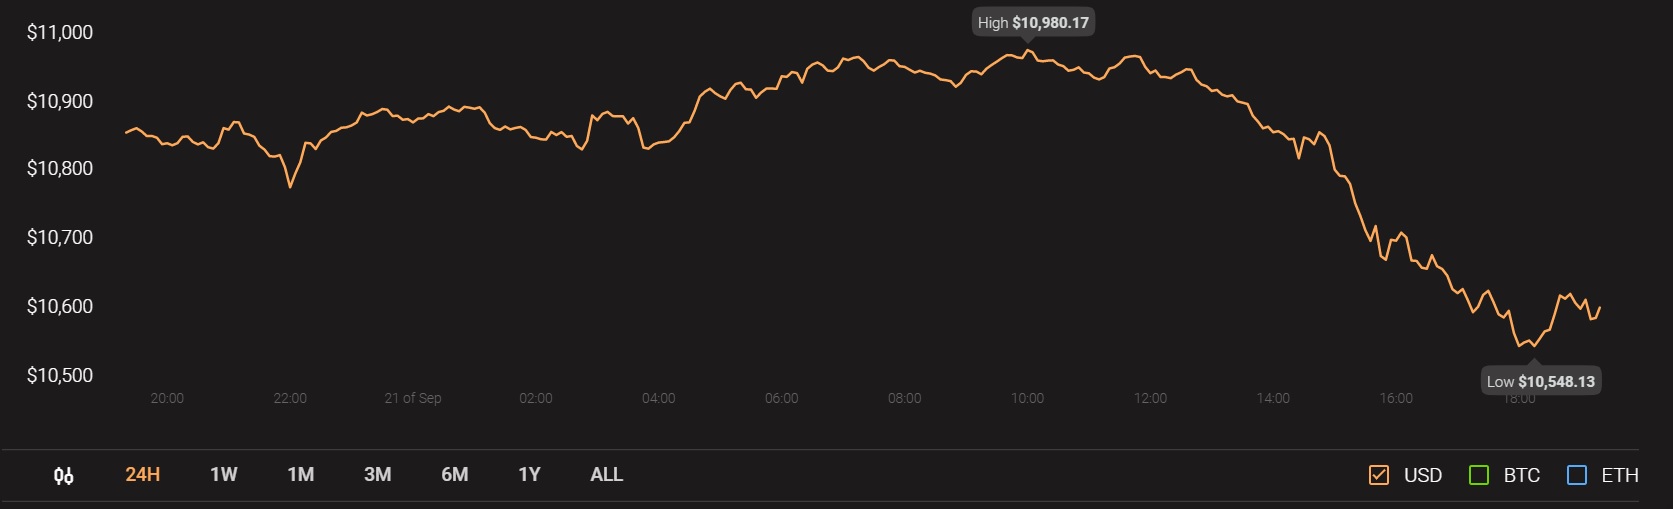
The other two over 10 percent deviations were the halving jump over $9,000 one day prior to the date of the third block halving at 13.7 percent, and the jump over $10,000 on 27 July, also at 13.7 percent. For context, the 4 September drop from $12,000 to $10,000 was a 9.7 percent deviation, outside the top-10, but worth a mention and the sixth-highest deviation all year.
Now that it’s all plotted, let’s look at the “non-volatile” bit. Again, this depends on how one would define what is “non-volatile.” For argument’s sake, let’s put a range of 0 to 5 percent. This means that an asset is non-volatile or is showing non-volatile tendencies if its deviation is less than 5 percent. Looking at Bitcoin, how does it fare?
Well, at first glance, you can see that a huge number of the points have been plotted below the 5 percent range, but just how many? Well, 166 days of the total 179 days were spent with non-volatile movement or with deviations less than 5 percent – That is a big fat 92.7 percent.
In summary, for all the trading days since the beginning of the year, Bitcoin’s average price deviation on a day to day basis is 2.3 percent, which is $250 against the press time trading price. The cryptocurrency spent 166 days with a deviation of less than 5 percent, 8 days with a deviation of 5 percent to 10 percent, and just 5 days with a deviation of over 10 percent. Does that sound volatile to you? Probably not.
Source: Coinstats