Bitcoin Cash, at the time of writing, was showing signs of bullishness, with the asset attempting to reverse the downtrend of the past few days. However, a confirmation of the same could still take a few days on the charts. On the contrary, DigiByte was struggling under strong bearish momentum. Further, Cosmos noted excellent gains recently to hit new ATHs, with ATOM expected to consolidate around new levels on its charts.
Bitcoin Cash [BCH]
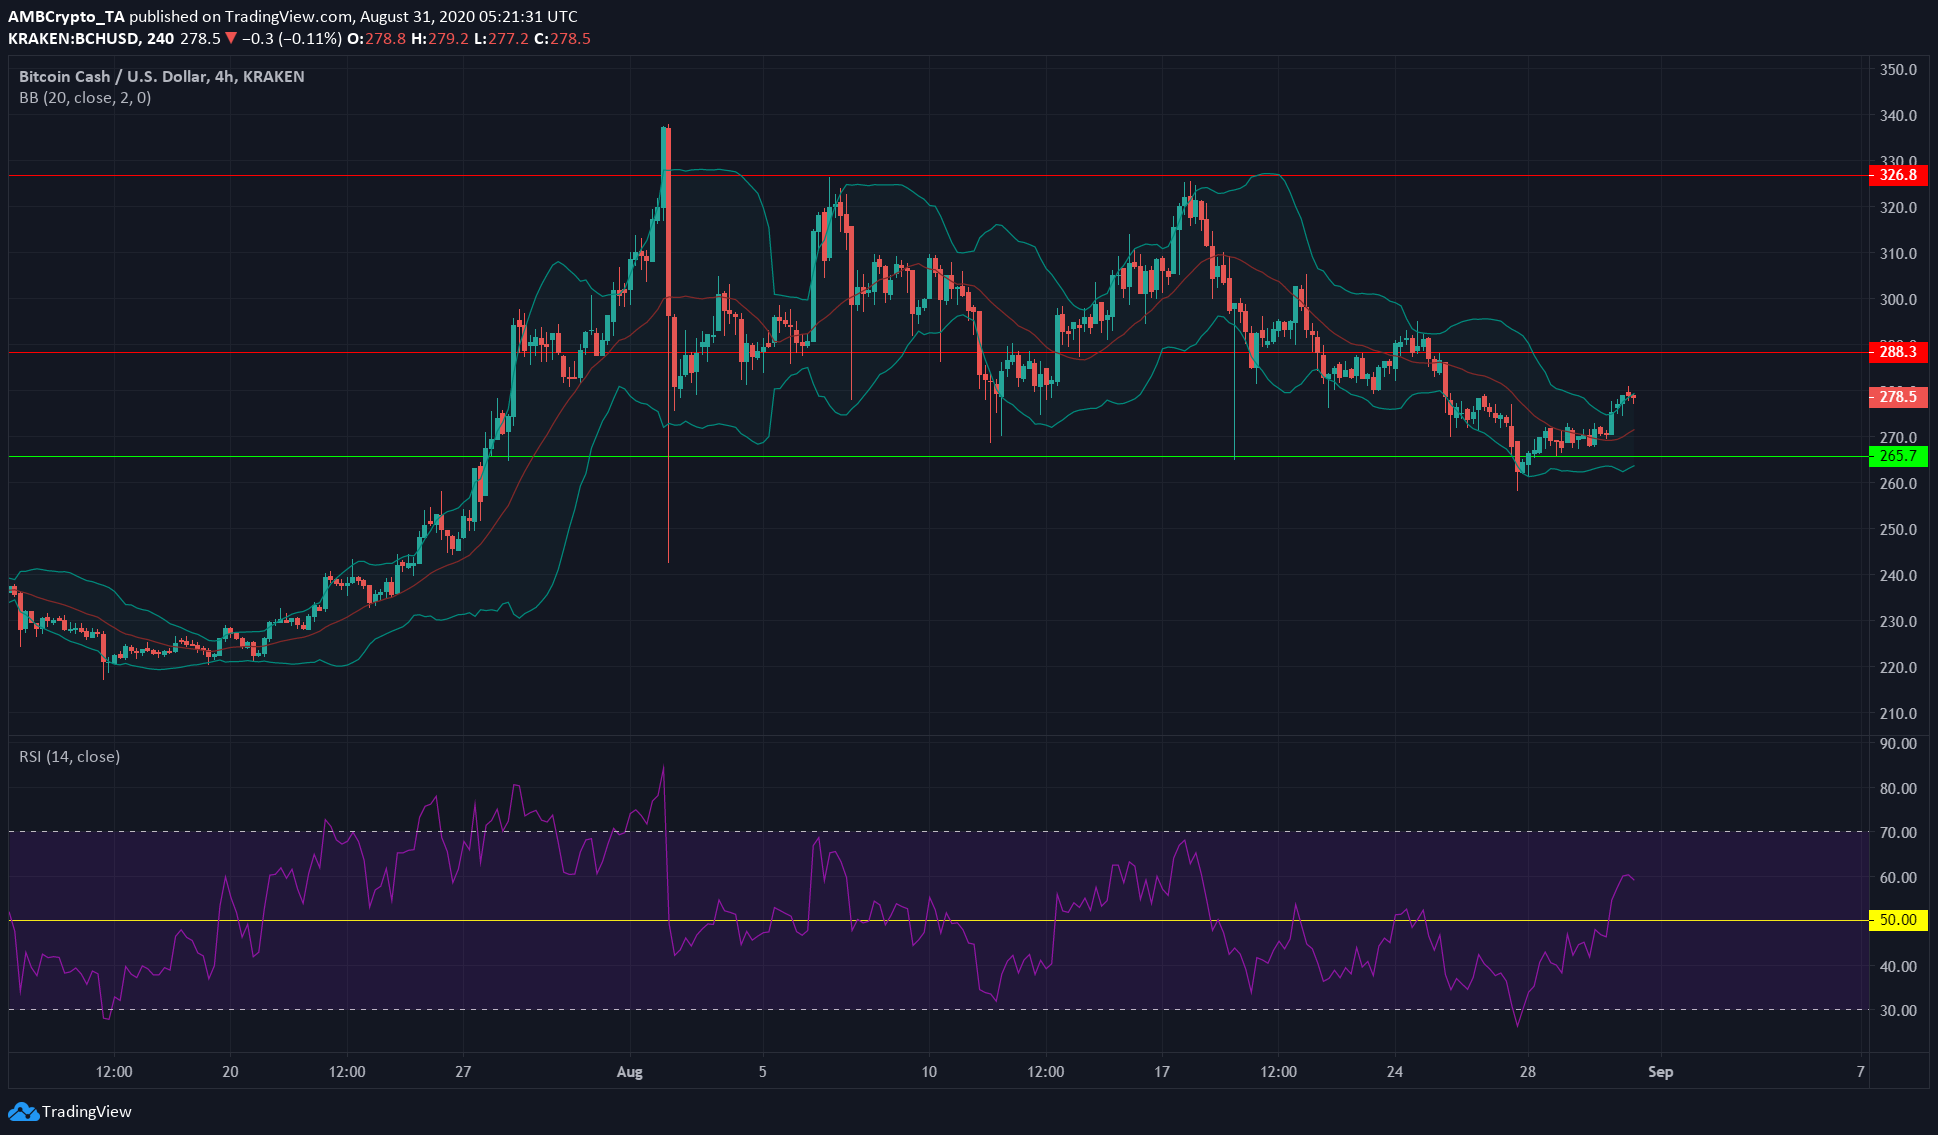
Source: BCH/USD on TradingView
With a market capitalization of $5.1 billion, Bitcoin Cash remains Bitcoin’s biggest fork, with the crypto-asset ranked 5th on CoinMarketCap.
Support for BCH lay at $265, while the resistance level was at $288. Bitcoin Cash has been in a downtrend for more than a week now and at the time of writing, BCH was trading at $278, while indicating short-term bullishness.
The Bollinger bands had tightened for a few sessions, before the price broke to the upside of the bands. The RSI showed a value of 60, a bullish sign. In fact, the RSI has also been making higher lows, along with the price, since BCH’s price dipped to $257 a few days back.
Bitcoin Cash was expected to test the resistance level at $288.
Cosmos [ATOM]
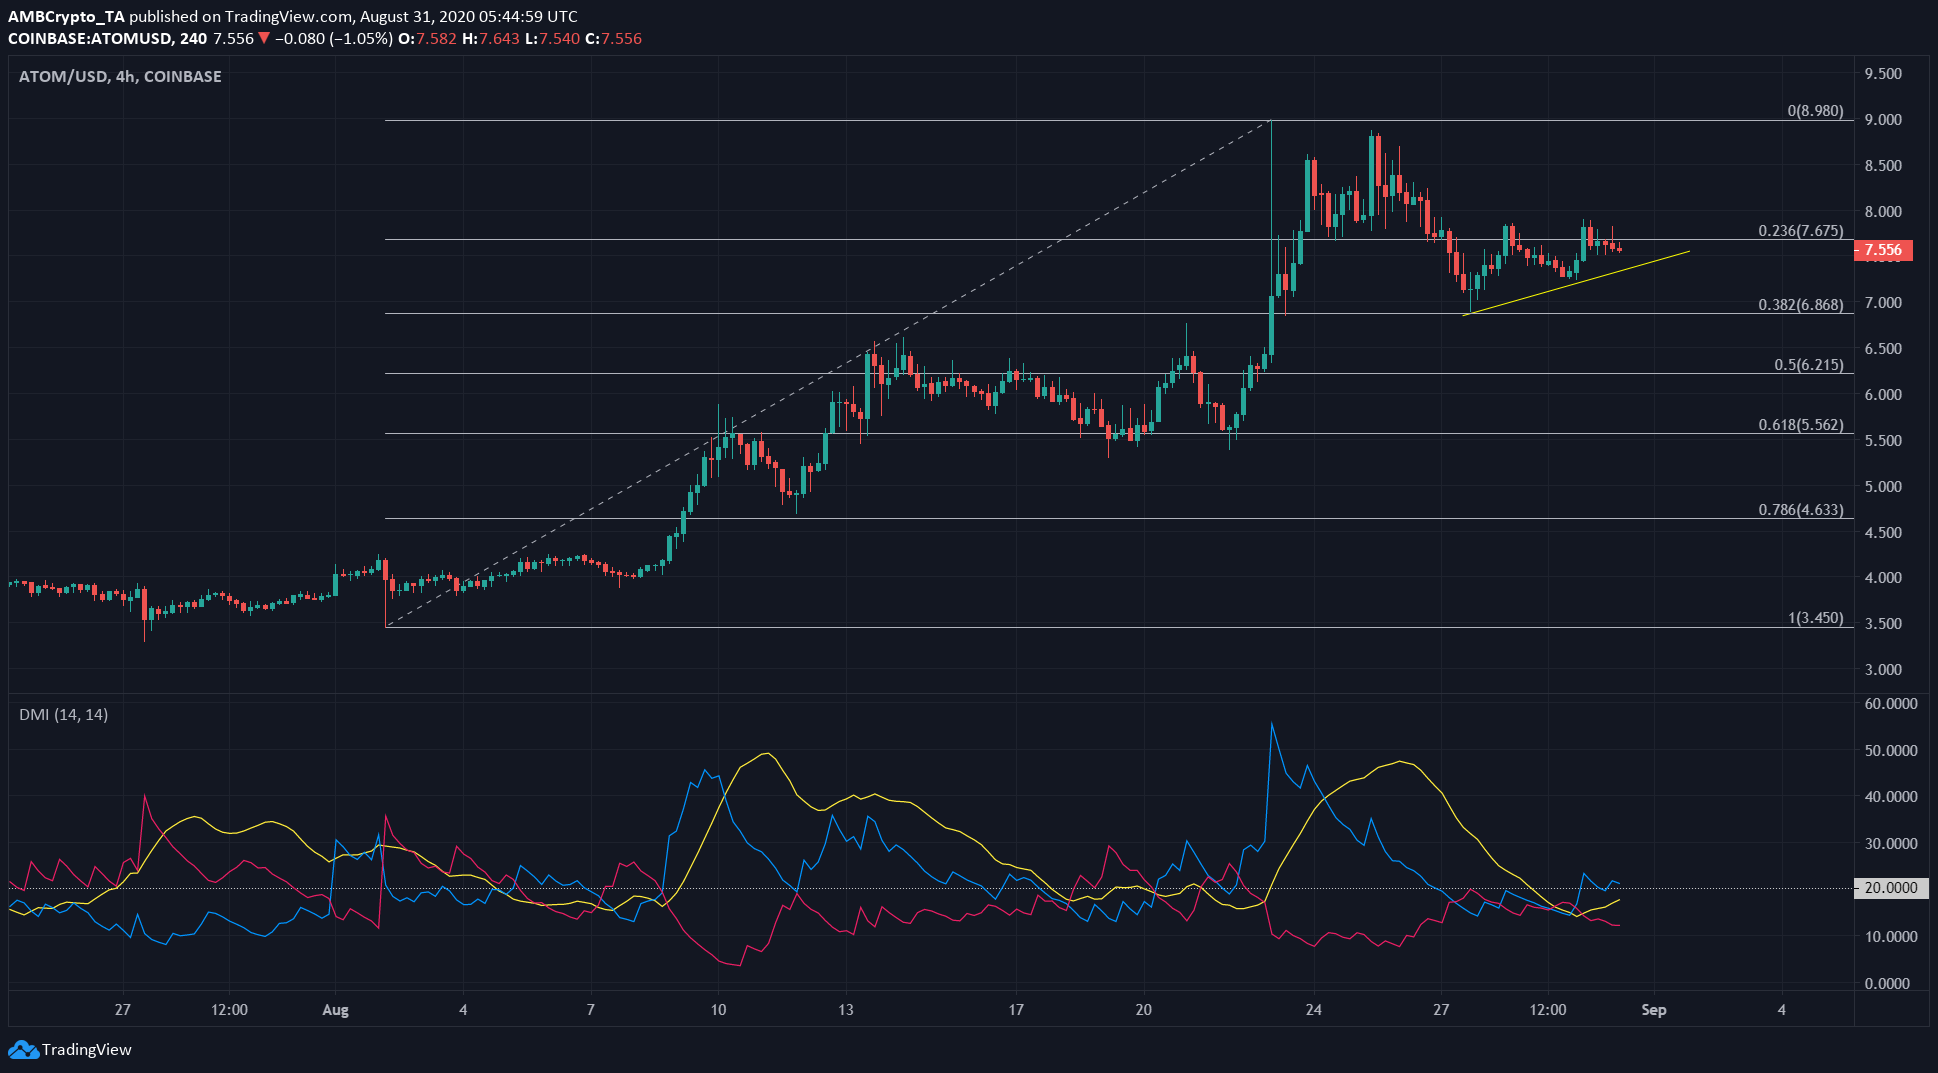
Source: ATOM/USD on TradingView
Cosmos was ranked 17th with a market cap of $1.5 billion, at the time of writing. It had a 24-hour trading volume of $350 million, a figure that was much lower than the average seen over the past few days.
Using the Fibinacci Retracement tool, important retracement levels were observed. At press time, ATOM was trading at $7.552, a level that was near the 23.6% retracement level at $7.67.
ATOM has been forming higher lows (indicated by yellow trendline) for a few days and could reclaim the $7.67 zone.
The Directional Movement Index (DMI) showed the lack of a strong trend, with ADX (yellow) below 20. A value above 20 is often used to signify a strong trend. Lacking upward momentum, it is likely that ATOM will break beneath the trendline to reach the support at 38.2% retracement level, $6.86.
DigiByte [DGB]
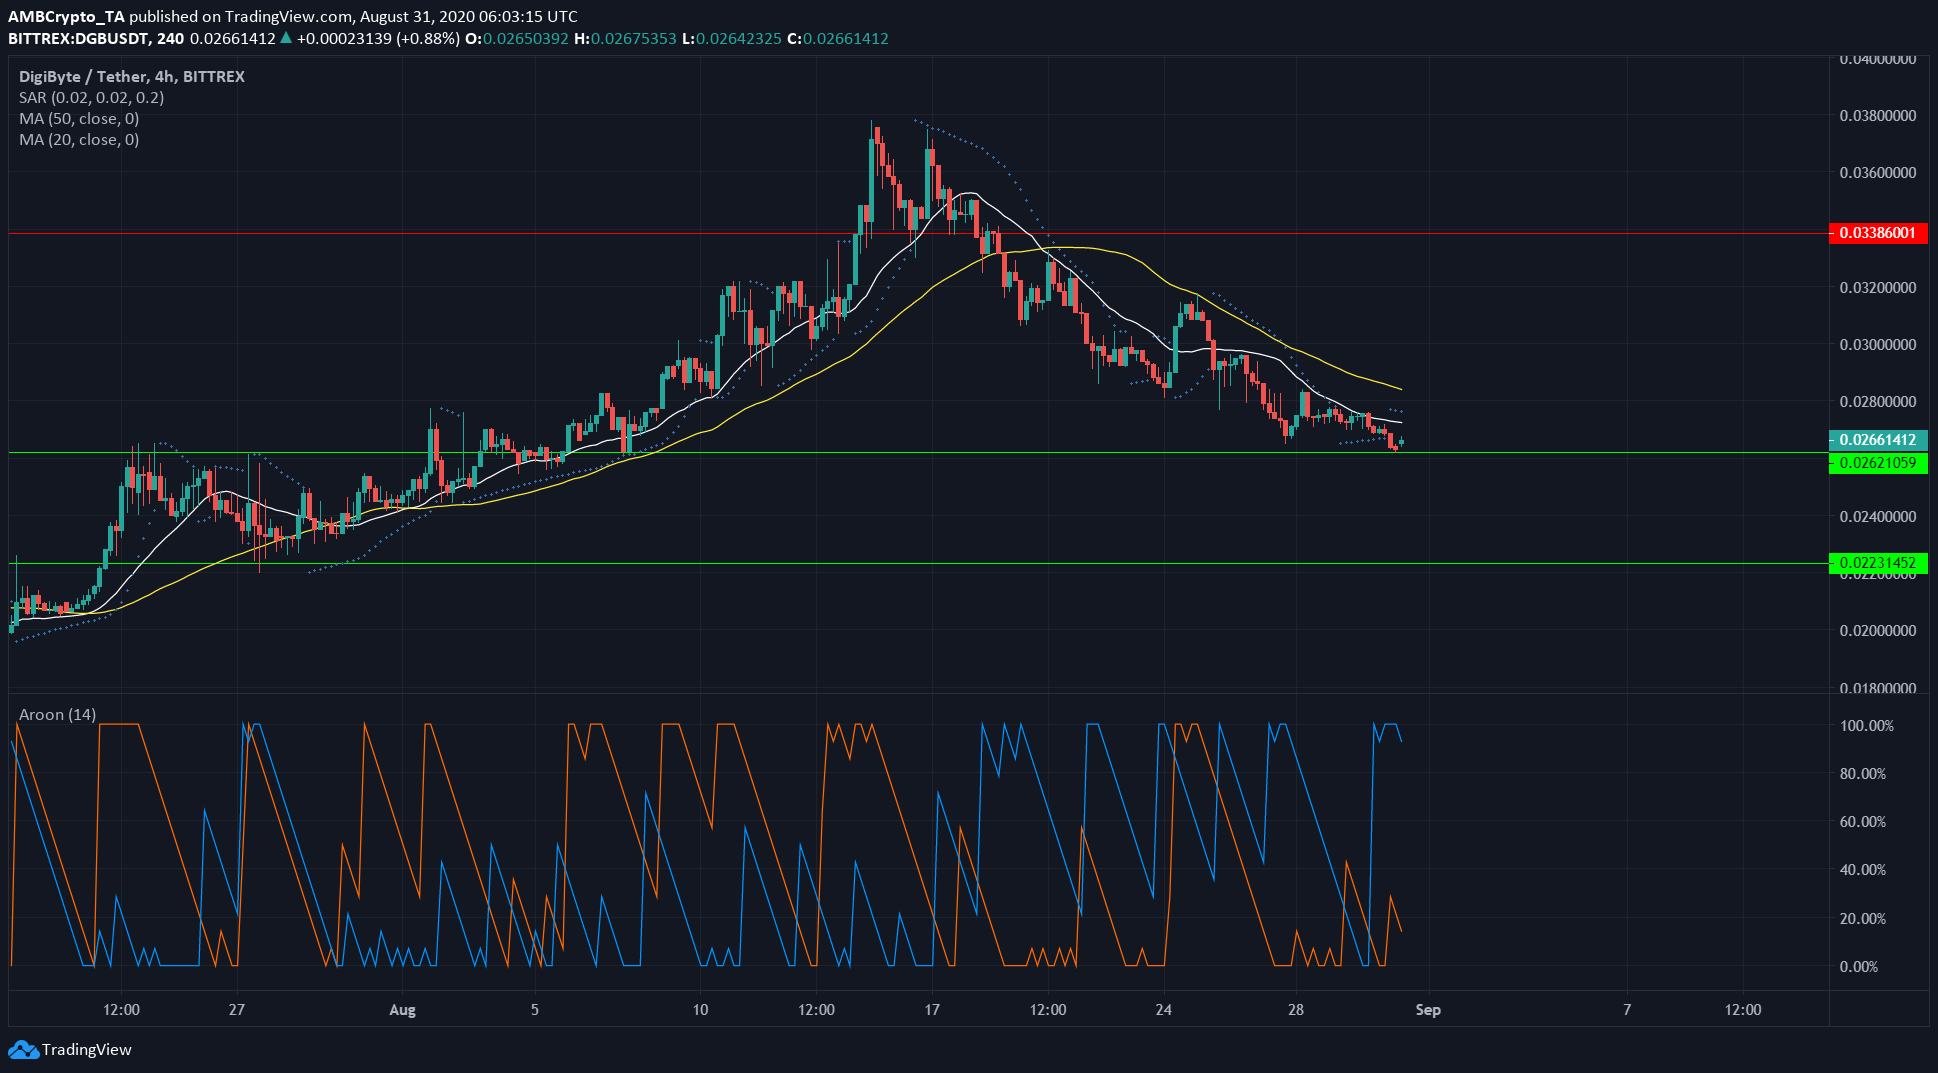
Source: DGB/USDT on TradingView
Digibyte has been seeing a lot of attention over the past few days, with at least 14,321 social posts and mentions just this last week. At press time, DGB was ranked 50th on the charts with a marketcap of $362 million.
The strong downtrend in DGB’s market was confirmed by the Aroon indicator and it showed no signs of reversing, at the time of writing. The Aroon Up (orange) had not crossed above and continued to stay below the Aroon Down (blue) on the charts.
Further, the 20 SMA (white) was well below the 50 SMA (yellow), showing bearishness. Finally, the Parabolic SAR also gave a sell signal.
If the support at $0.0262 does not hold, DGB might be forced lower to $0.0223 on the back of this downtrend. We can expect DGB to bounce and meet resistance at the simple moving averages. A bullish case in the short-term cannot be made until price trades above the 50 SMA for a few sessions.