Disclaimer: The following article attempts to analyze the emerging patterns in Bitcoin Cash’s long-term market and its impact on the price
While the Bitcoin Cash upgrade has been scheduled for 15 November, there has been a longstanding debate about the fork coin’s difficulty adjustment algorithm [DAA]. Despite the many controversies BCH seems to be embroiled in, the cryptocurrency’s price remained stable, or rather stuck, at $268, with BCH having touched its yearly peak of $503 back in February 2020. Given the fact that the beginning of the year ignited a short-term rally in the market, the crash in March came as a surprise since the pressure hence created wiped out all of BCH’s gains.
Since it is a Bitcoin fork, the crypto-asset has historically remained highly correlated with it. However, as Bitcoin consolidated at press time, BCH was noting downward pressure on its charts. According to CoinMetrics‘ chart herein attached, BTC-BCH shared a correlation coefficient of 0.9083, whereas Bitcoin SV shared a correlation of 0.8339. While BCH was extremely correlated to BTC, Bitcoin SV was among the coins sharing low correlation with the world’s largest crypto-asset.
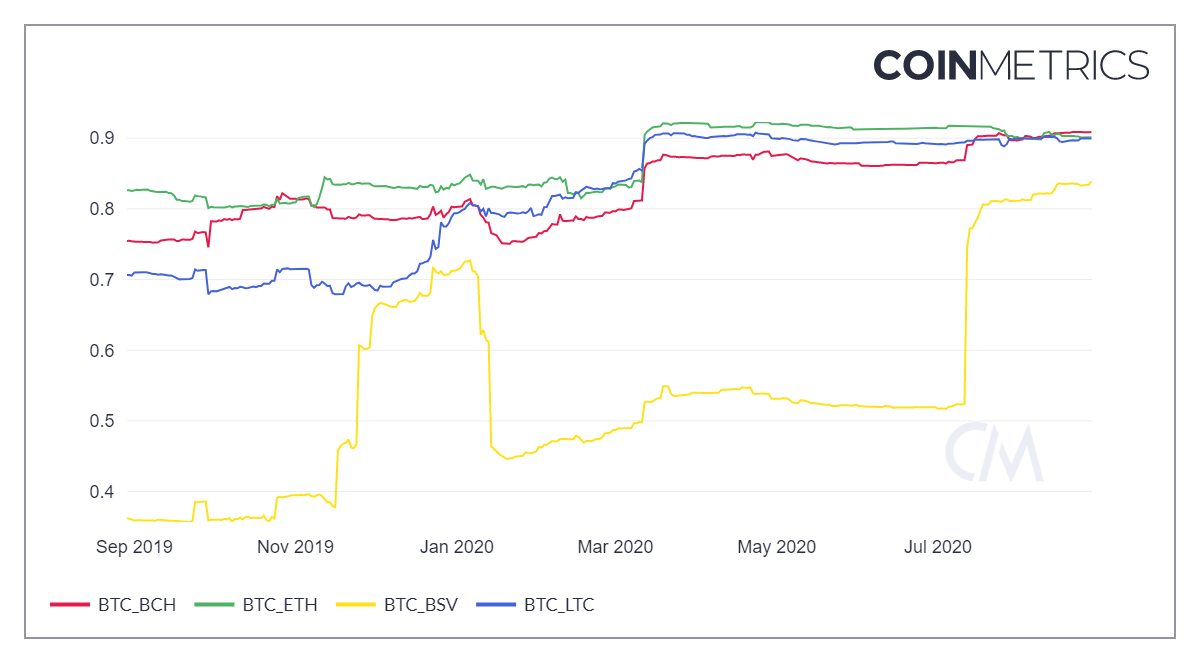
Source: CoinMetrics
Due to the constant push and pull in the Bitcoin market, Bitcoin Cash’s value gradually fell on the charts over the past few days. The chart below highlights the price falling within the descending channel after witnessing great volatility. The Bollinger Bands appeared to have converged, which was a sign of low volatility, but the bearishness had just begun.
As the moving average and the signal line moved above the price candles, the price trend changed. This meant that the traders were primed to sell the digital asset, something confirmed by the MACD indicator. The movement of the MACD line under the Signal line was an indicator for the traders to sell the crypto-asset. This has been going on since 11 August, and even the daily chart underlined this bearishness in the BCH market.
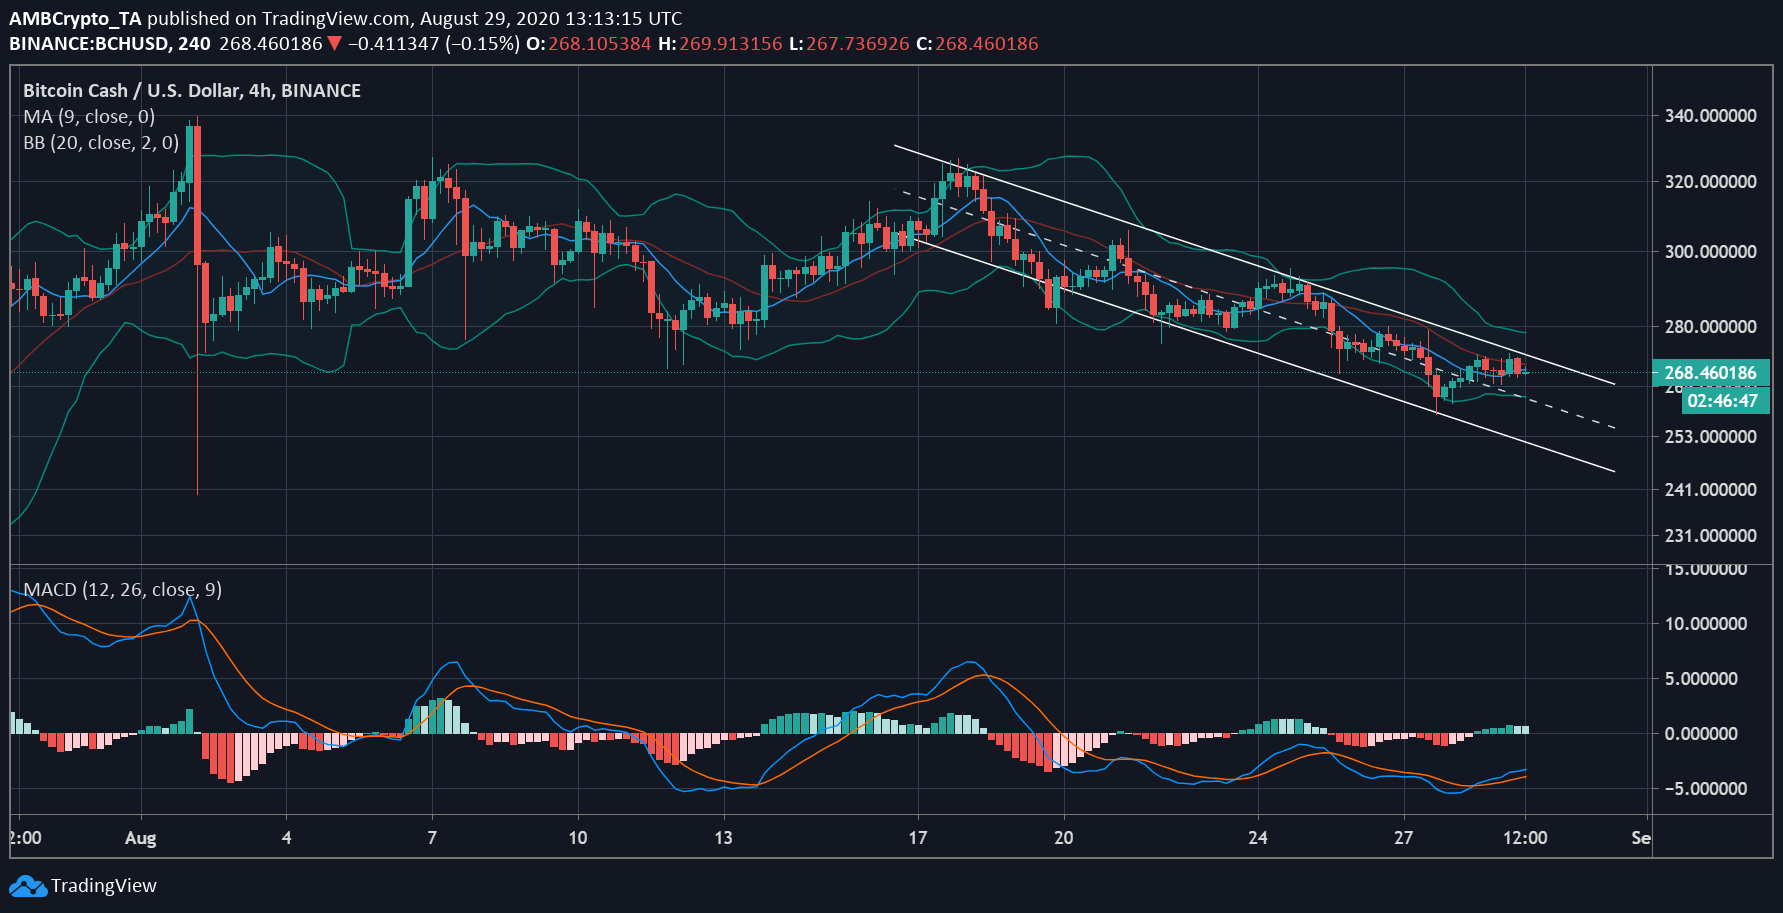
Source: BCH/USD on TradingView
As Bitcoin Cash’s price moved lower, it was closer to the Fibonacci retracement level of 61.80% at $273.95. In the given time period, this level was acting as BCH’s immediate resistance as the coin had not yet managed to breach this level. Its immediate support lay at $258.40, a level that had been tested before, before the price bounced back immediately.
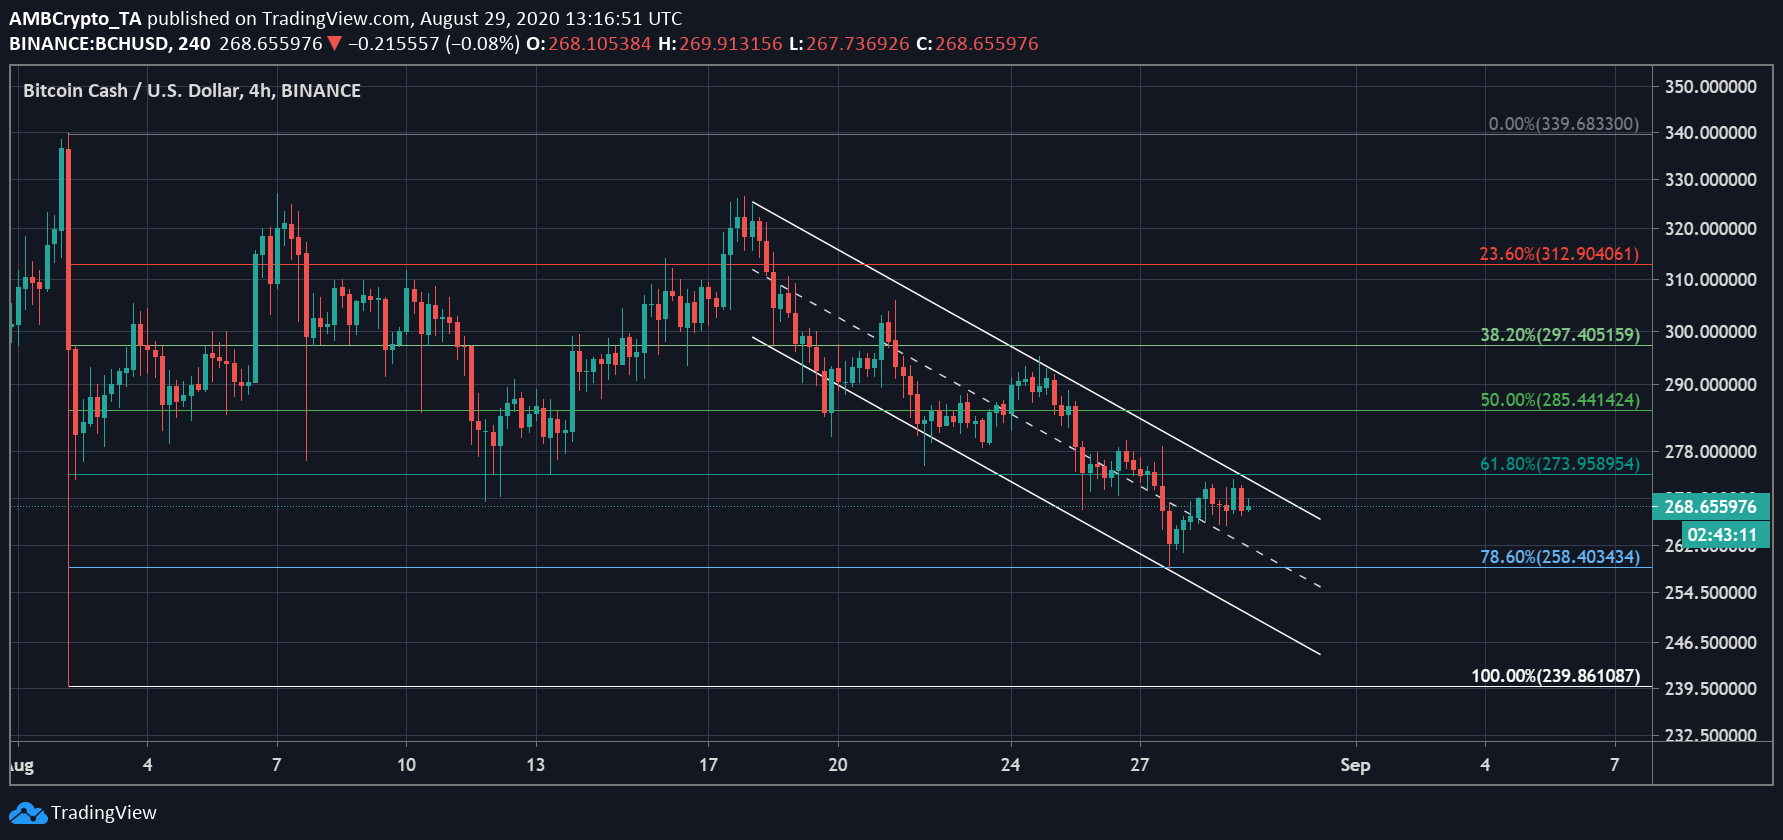
Source: BCH/USD on TradingView
If the selling pressure in the Bitcoin Cash market falls, BCH may record a trend reversal of sorts. Until then, it may keep stalling at the press time price level.