
The prophecized golden cross is clearly taking its time to kickstart the rally. At press time, BTC was worth $9,670, slightly higher than last week’s close [$9598]. On the weekly time frame, Bitcoin’s rally hinges on how February ends. For now, the rally to $10,500 looks like the local top and a correction is underway.
The question is, ‘correction to what level?’
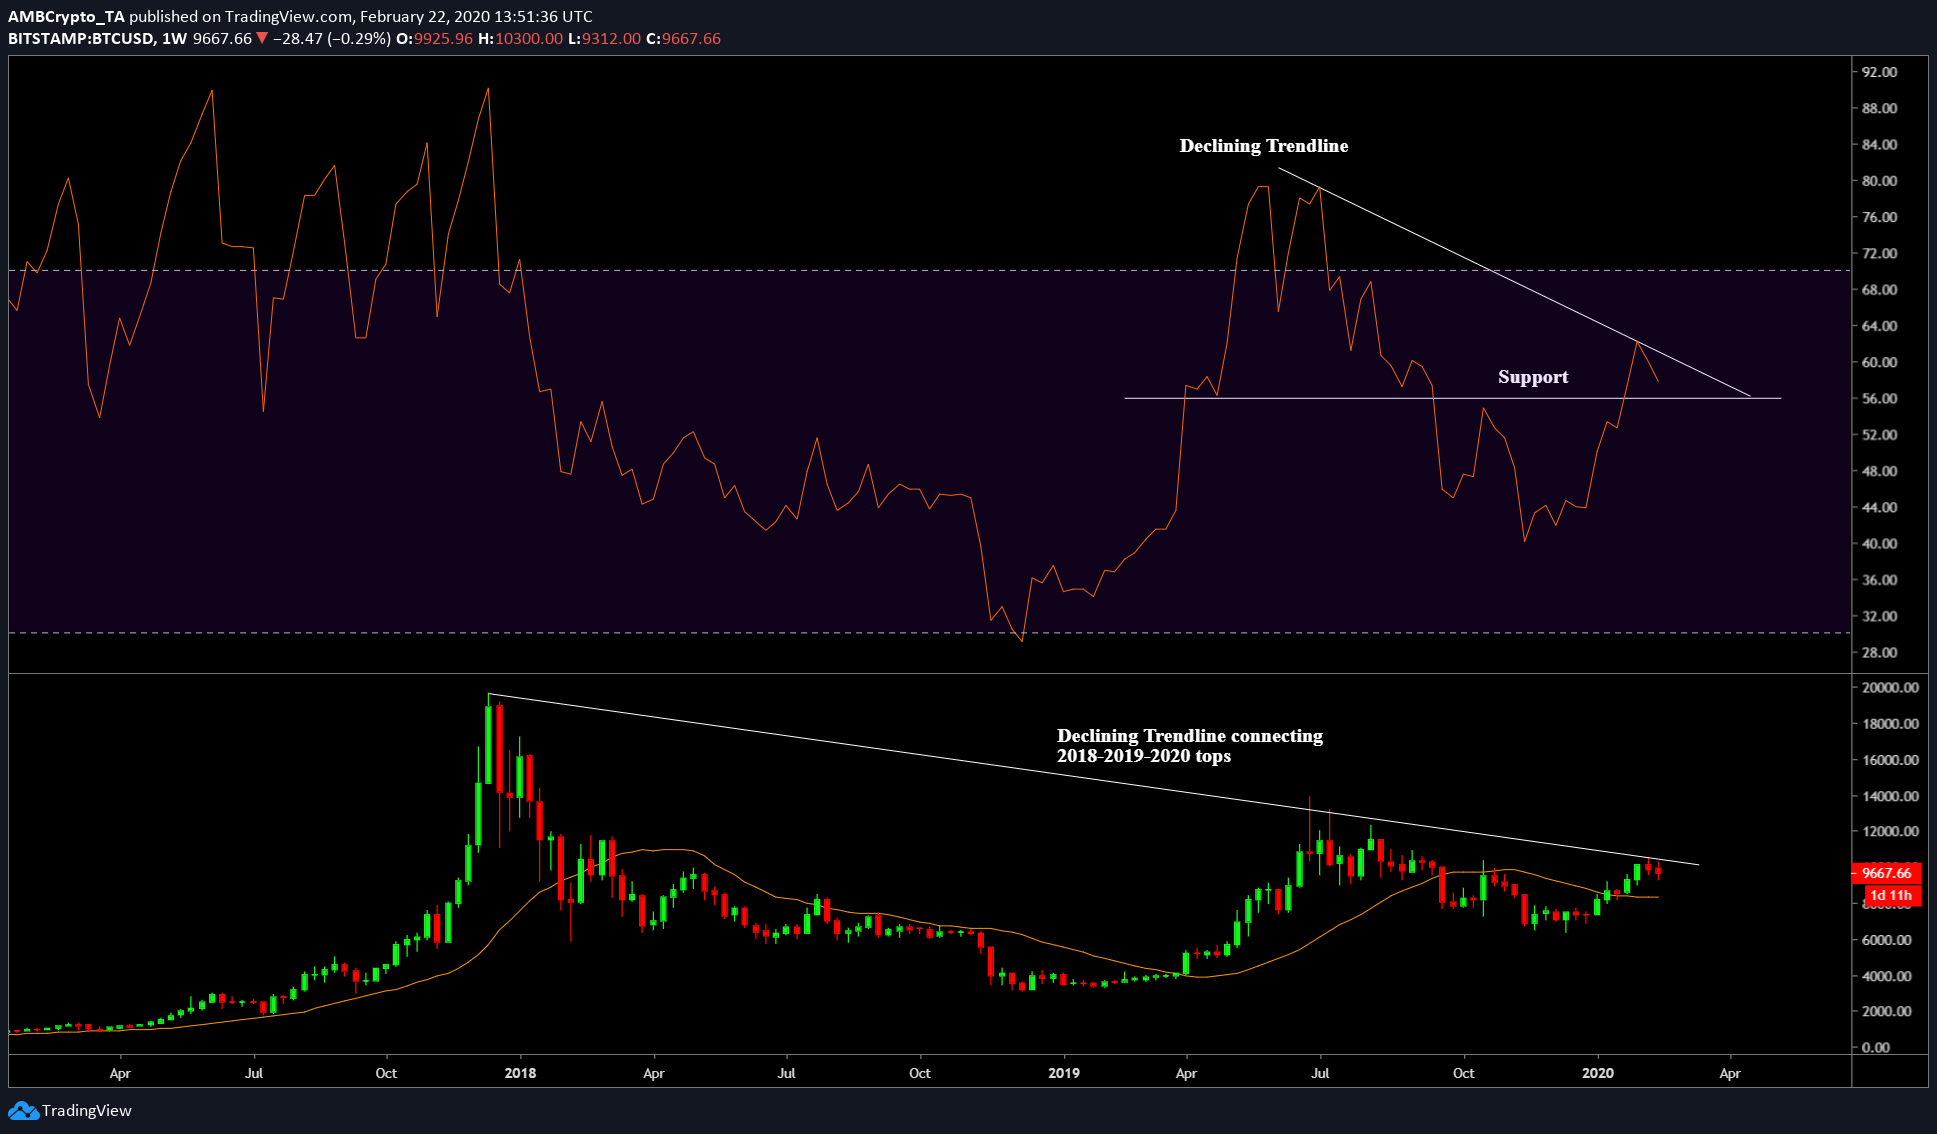
Weekly

Source: BTC/USD on TradingView
On a weekly time frame, the price has a leeway to drop to $9,075; this has a higher chance of catching the price’s correction. Moreover, this could also be the level the price might rebound off before starting its rally. However, even a rally from this local bottom would cause major resistance at $10,300 and $10,500, both of which are prior weekly highs.
Further, the declining trendline extending from 2017’s highs connect the mid-2019 highs and the current high at $10,500. Hence, a confluence of all these levels will be a hindrance to the rally.
Contrary to all of the above, the price looks overly bullish considering the 21-weekly moving average.
Source: BTC/USD on TradingView
The Weekly RSI indicator showed a decline, similar to the price, indicating a bullish future for Bitcoin. However, as seen, RSI’s downtrend might face some small support. Therefore, the RSI’s descent to that support might take Bitcoin to the aforementioned level at $9,075. This could be the last pullback below $9,000, before the rally commences.
Daily

Source: BTC/USD on TradingView
The daily chart provided an alternative view of Bitcoin’s future. As seen in the daily chart, the price level between $9,636 to $9,770 is a deciding level. For the price to rally higher or go lower, it needs to bounce or breach the said range.
For the Fibonacci level, that extends from $3,120 to $13,800; the next level for Bitcoin after breaching the $9,770 level is 11,577. However, if the price breaches $9,636 and closes below it, the next immediate yet lower level is $8,950.
Hence, the daily chart presents a whole set of opportunities, but over a much smaller time scale.
Conclusion
Albeit unlikely, considering both the weekly and the daily time frames, the higher level to watch out for is $10,500 and the lower level is $9,065. However, the daily time frame seems more chaotic and less likely. The weekly time frame presents a more achievable scenario.