Bitcoin has had a good week, with its prices moving up 5.88% over the past week, making the latest candle the 6th consecutive green weekly candle. However, this might change and the bears might assume control of the situation soon, at least in the short-term.
At press time, BTC was trading at $7,543, with the charts showing signs of a Bart pattern.
Four-hour chart
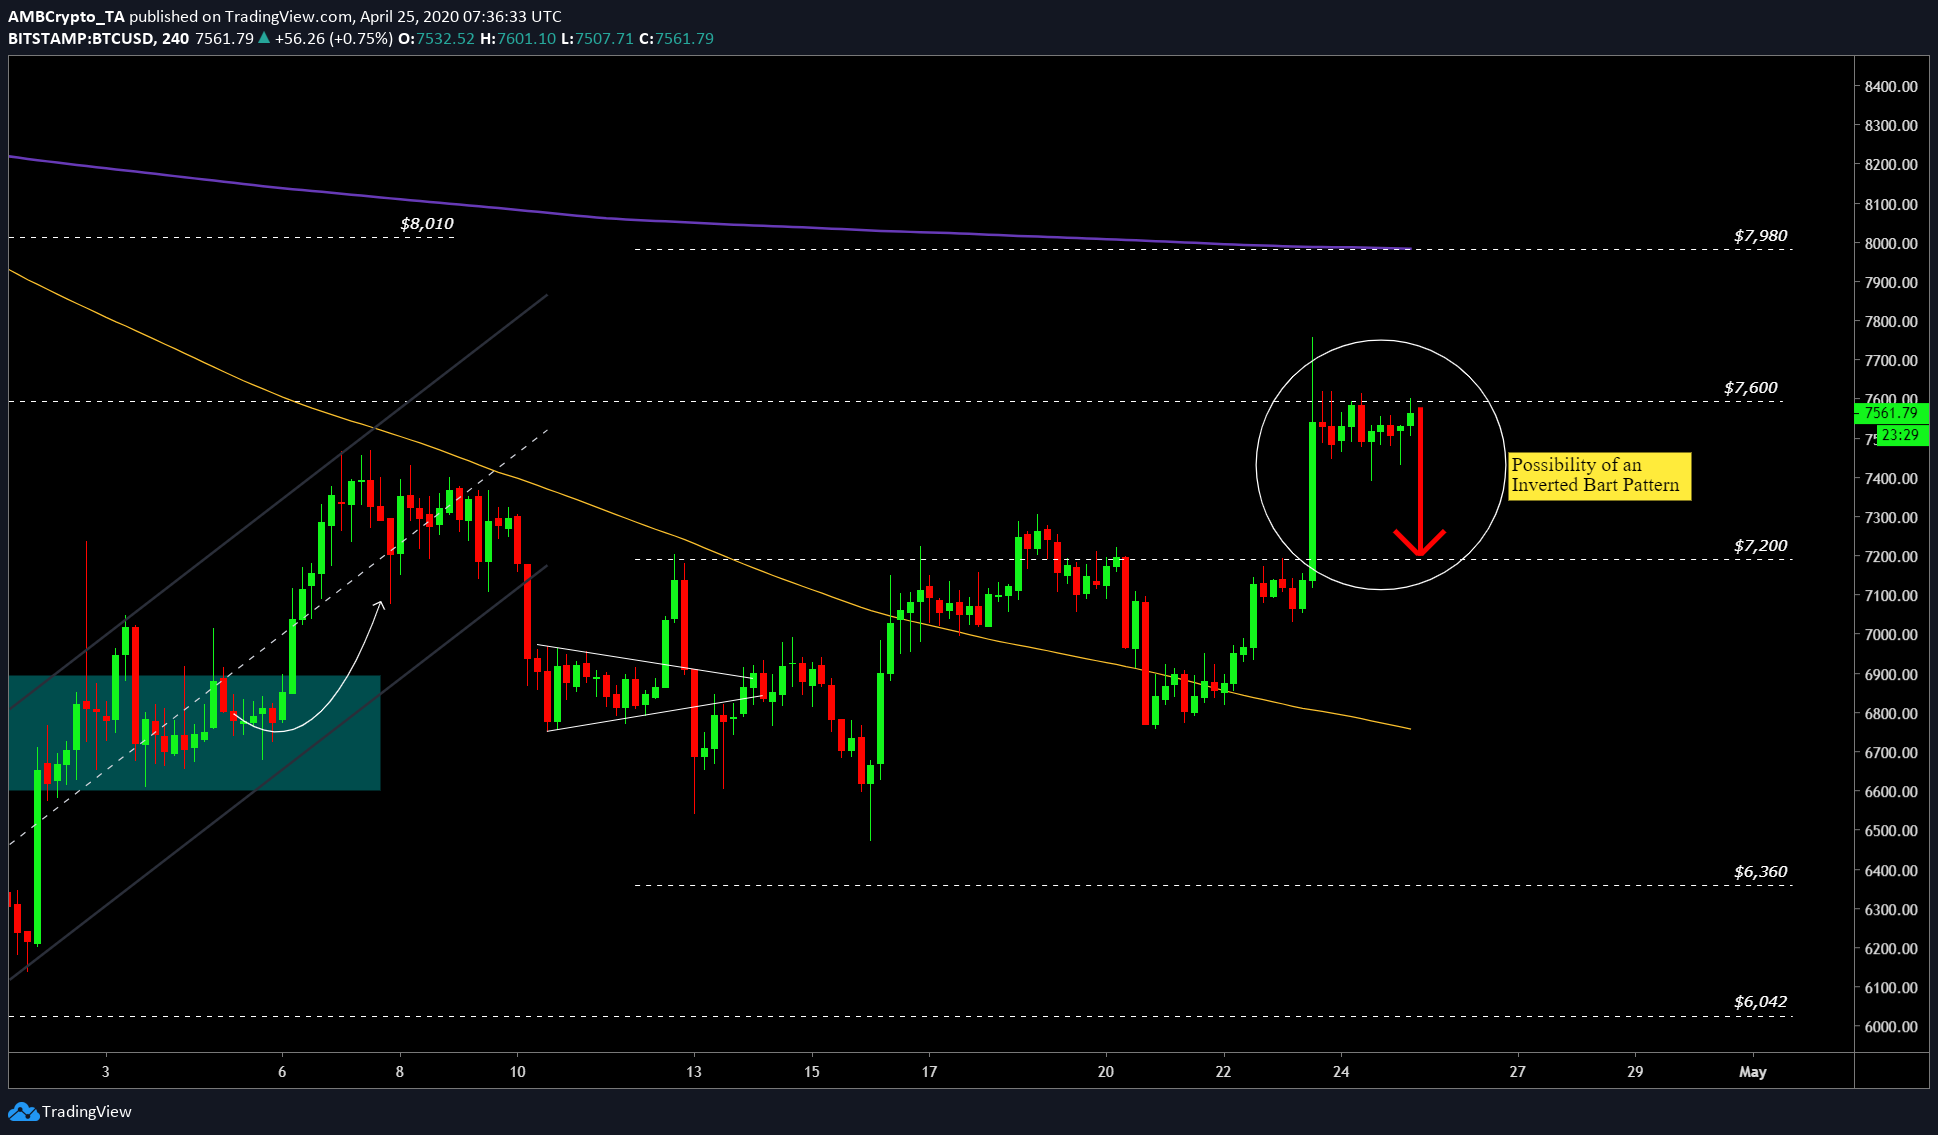
Source: BTC/USD TradingView
Over a shorter timeframe of four hours, the price of BTC looks primed for a Bart pattern. This is a bearish pattern, with the price surging suddenly, followed by sideways movement devoid of volatility. The pattern ends with the price retracing to the initial point. At press time, this seemed possible, especially with the resistance at $7,600.
Additionally, this pattern could push the price back to $7,200 and lower. This pattern has occurred frequently with Bitcoin and shows how the volatility in this ecosystem is different, when compared to equity markets. At the time of writing, the price had already developed a red candle, with 3 hours until the close.
Weekly Time frame
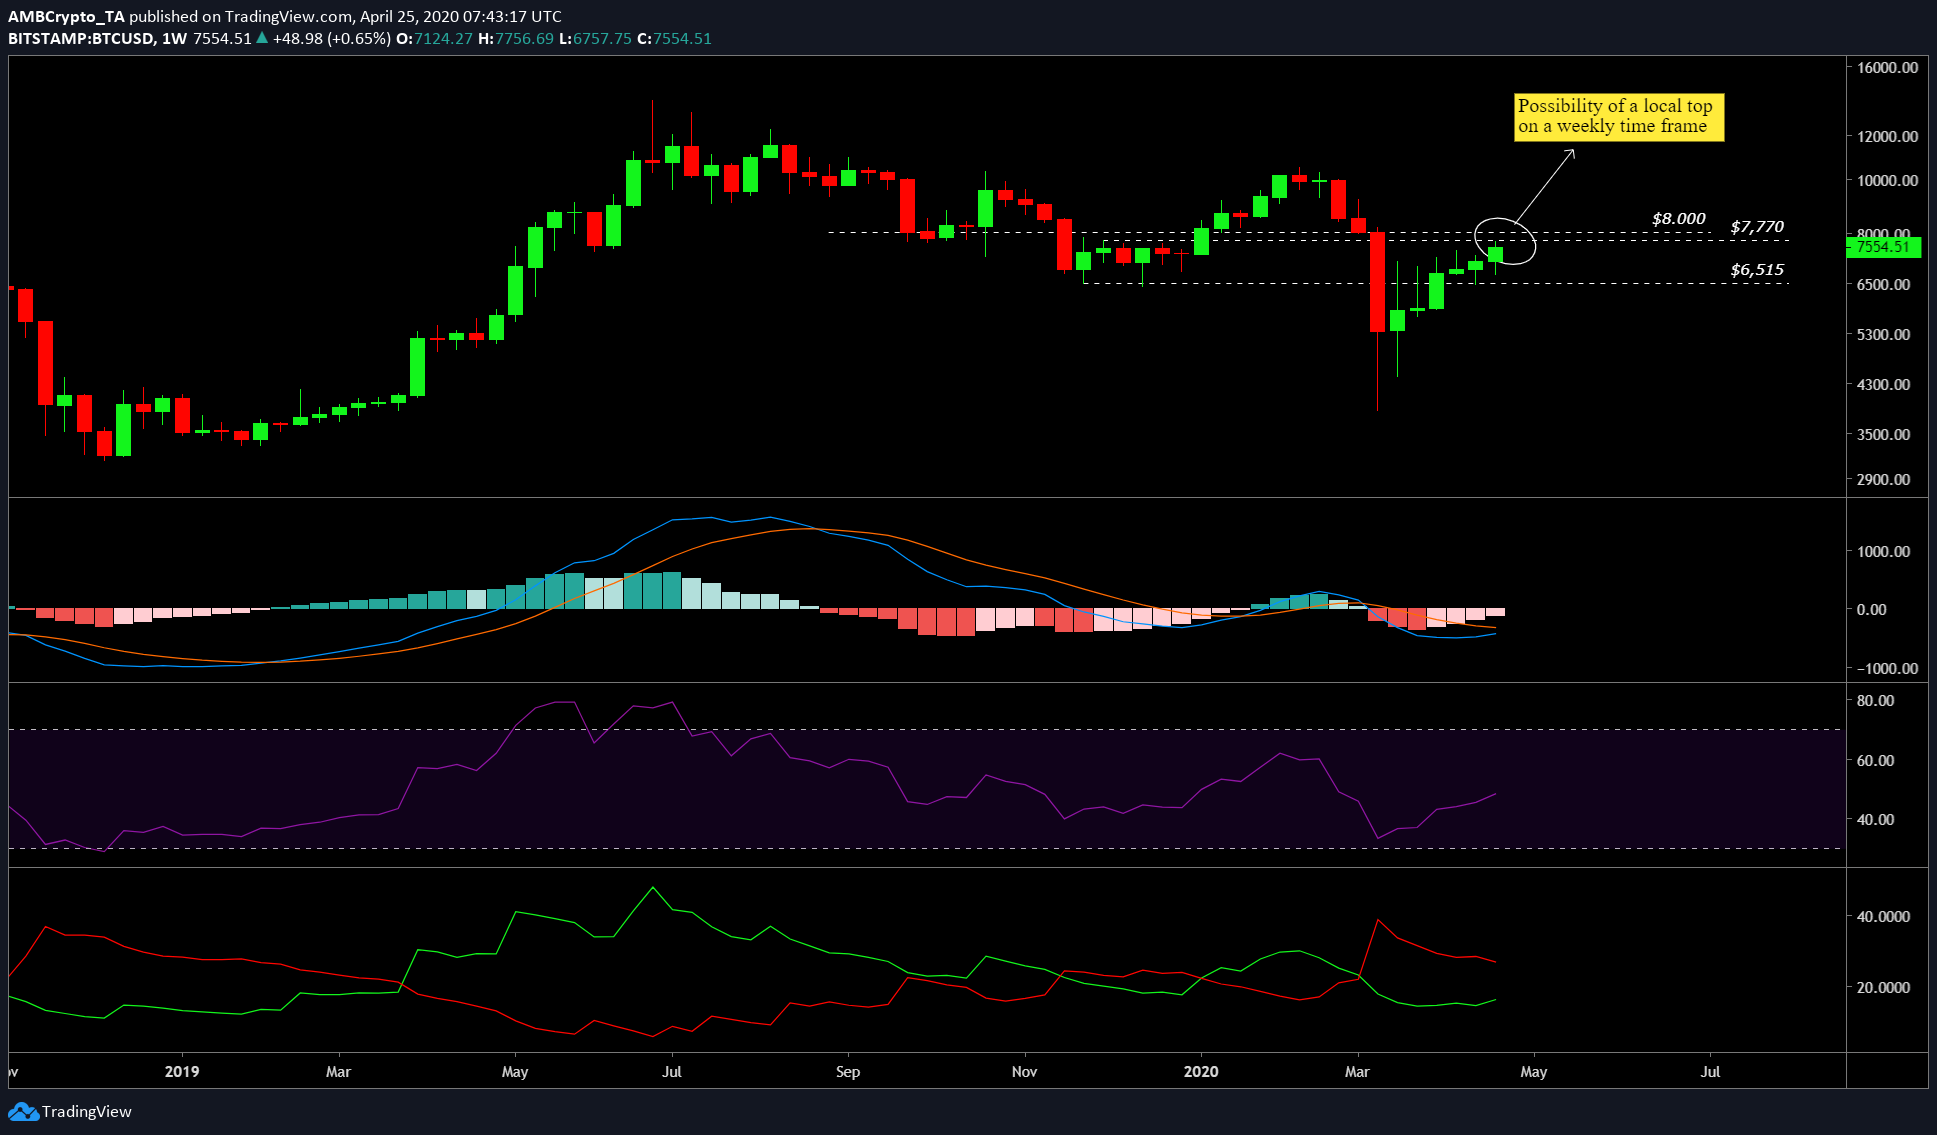
Source: BTC/USD TradingView
On the weekly time frame, the coin seemed extremely bullish with five consecutive weekly green candles. Perhaps, this is BTC reverting to the mean after the dip that took place in March, or it could be Bitcoin surging due to the approaching halving.
Either way, on the weekly time frame, the MACD indicator was hinting at a bullish crossover, which hasn’t happened since February. Additionally, Bitcoin’s charts showed the momentum for buyers picking up, with the RSI indicator [purple] rising slowly. Further, the Directional Movement Index showed a bottoming of bears on the weekly time frame, suggesting the same as the aforementioned indicators.
Conclusion
Even though the weekly timeframe points to a bullish outlook for Bitcoin, a fall in the price over a lower time frame seems possible. Further, the Bart pattern would only reduce BTC’s price by 5.78% [$7,200] and this would still leave the weekly time frame another day to cope up and print the sixth consecutive green candle.