
Bitcoin, as everybody is witnessing, is stuck in a pattern for over 3 months now, especially since it hit a peak of $13,800 on June 26. This traversing of price in the pattern has been a godsend for traders who know what they are doing; it was a good time to make some profits; it was also a good time for noobs to get liquidated on their positions, especially considering the recent 4% to 5% spikes witnessed in the last couple of hours.
A Look at Bitcoin prices on a Macro Scale
It is a well-known fact that 200 daily moving average is a very reliable indicator to judge if Bitcoin is in a bull market or a bear market. Looking at the history this makes a lot of sense; whenever the price has managed to cross above the 200-DMA, it was bull run and the same is true for the converse. But what most people forget is that sometimes Bitcoin fakes this, and looking at the charts, this may be one of those times, considering how the price is consolidating.
Examples of 200-DMA fakeouts
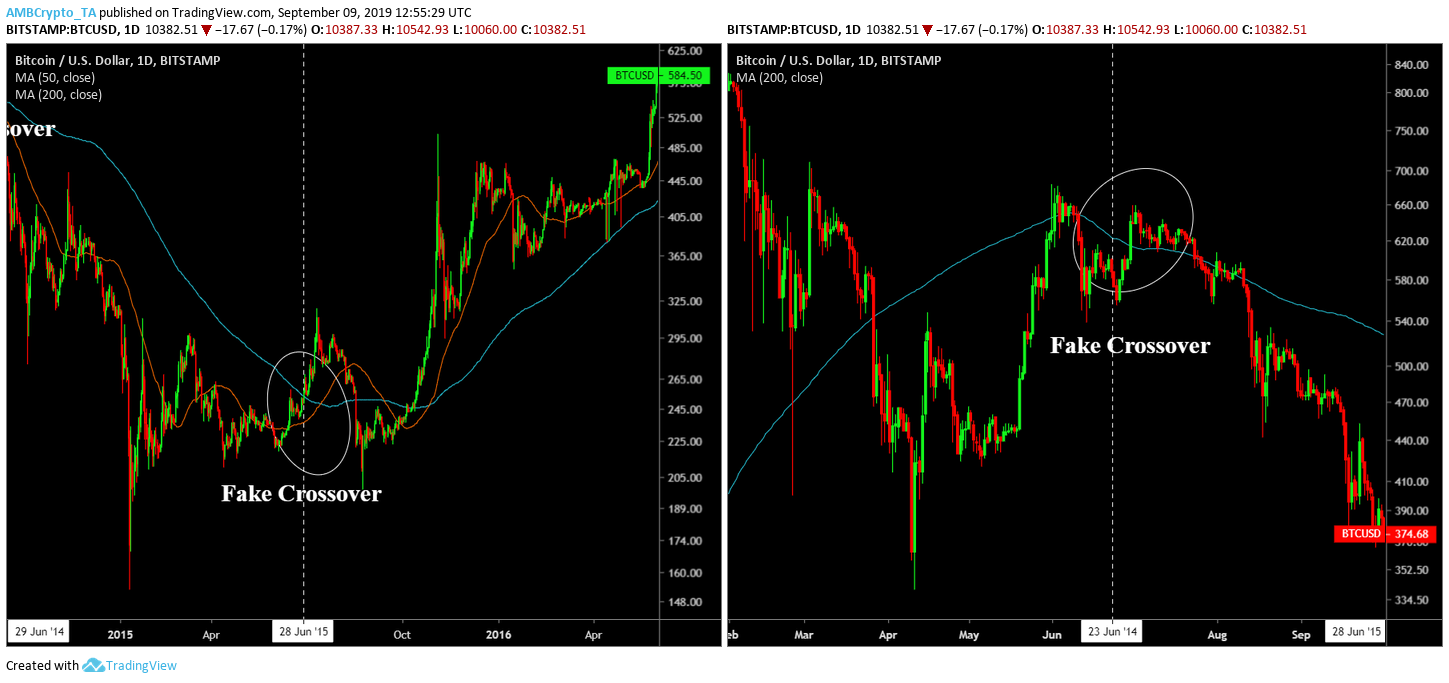
Source: TradingView
There are three major reasons that would suggest that Bitcoin’s run-up from April 2019 could turn out to be fake.
- From the past fake-outs, it is apparent that Bitcoin has a tendency of pulling a fast one on all of us. There are, however, hyperbole theories that could weigh in on this. But they are in fact hyperbole and exaggerated.
- At press time, although Bitcoin has spent sufficient time above 200-DMA, there is still a chance that Bitcoin might just be faking it. Adding more credibility to this situation is the pattern that is being formed and nearing breakout from descending triangle.
- Another important thing to look at is the bull run in April 2019. It was parabolic, which caused BTC price to sway further away from moving averages and average price point. Usually, when this happens, the price self-adjusts to come back to appropriate price levels. Look at what happened after the 207 bull run, the price adjusted itself, found a bottom and stuck there for a while. This is called “mean reversion”.
Mean Reversion
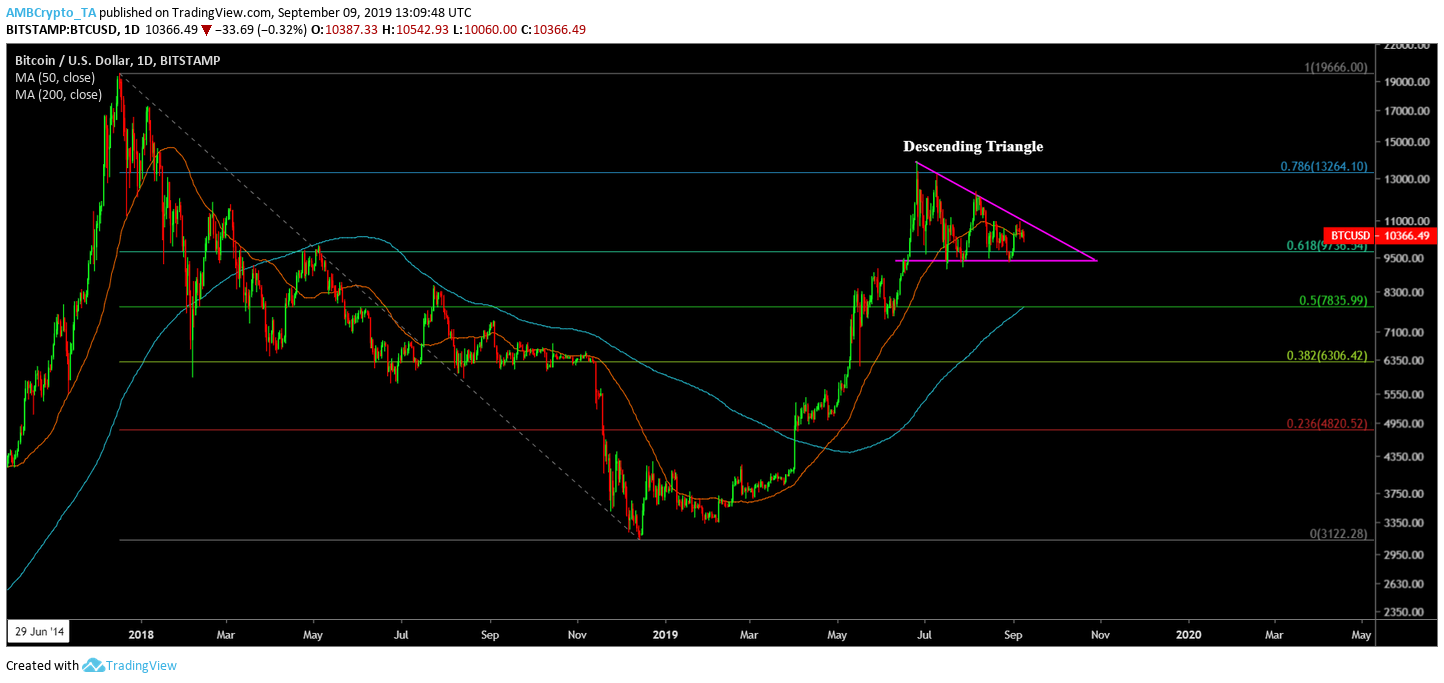
Source: TradingView
If a mean reversion is in play, which would mean that the prices will adjust and return eventually to their long-term mean or average level.
How?
If Bitcoin, which is stuck in a descending triangle, decides to breakout bearish, then this would be a step closer toward fulfilling the mean reversion prophecy. For most of 2019, price has hit the 0.618 Fib level and bounced between that and 0.786 level, which led to development of the descending triangle. The pattern will allow a maximum of 2 to 3 bounces inside it, following it would be a volatile breakout, no matter what the direction.
The breakout would and could result in price hitting lows of $8,500 to $7,000 as mentioned previously. This would be an appropriate mean reversion as prices would meet 200-DMA halfway.
RSI indicator, as seen below, indicated a formation of a falling wedge ~60% complete, which would indicate a further collapse of RSI, further indicating a drop in prices.
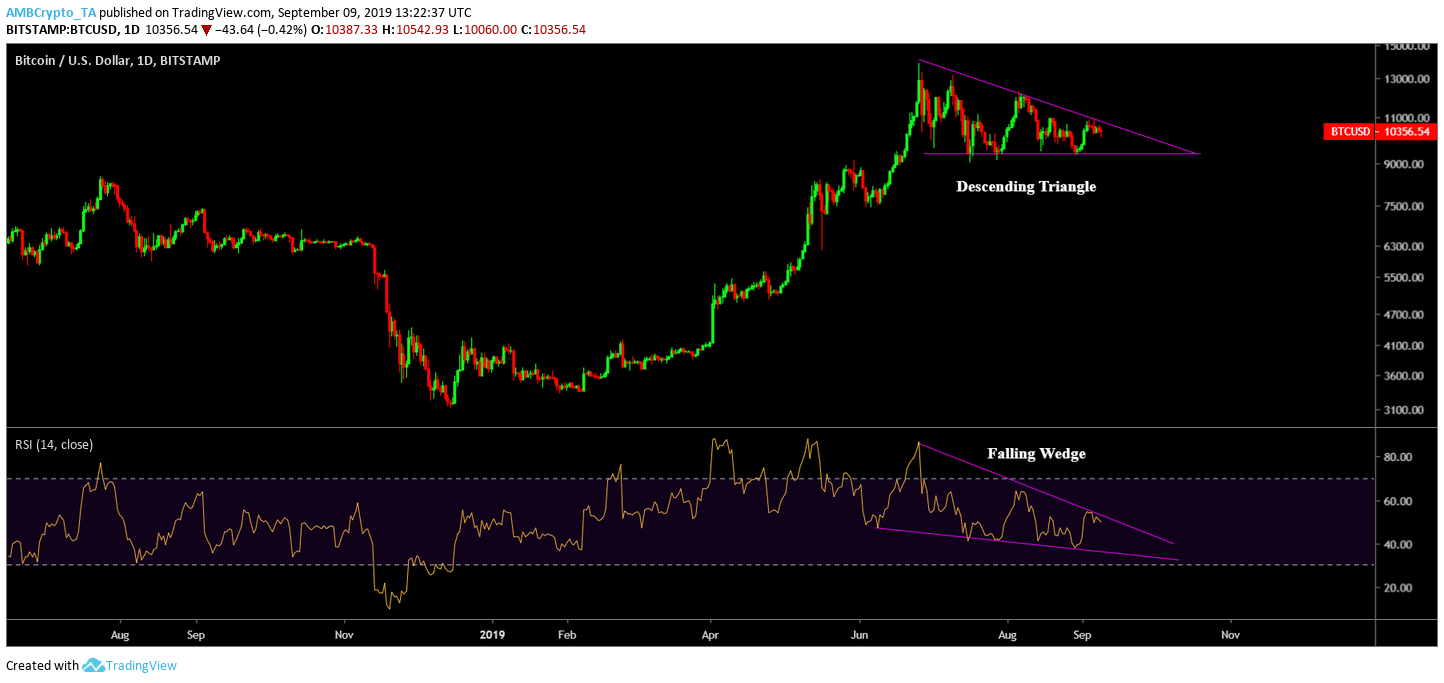
Source: TradingView
Right Here, Right Now
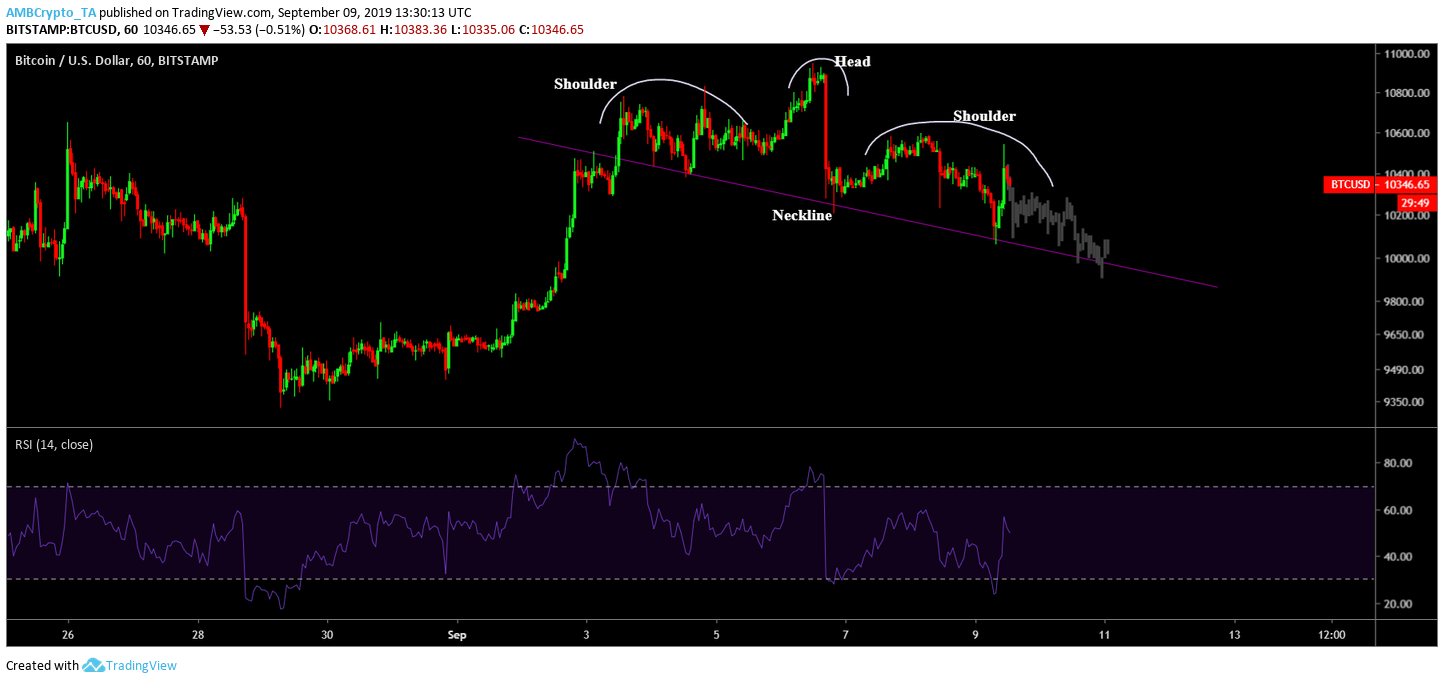
Source: TradingView
The one-hour chart shows BTC price promptly forming lower lows for over 4 days; when combined with its tops, it looks like a potential head and shoulder pattern in the making. Then again, head and shoulder pattern for Bitcoin or other cryptos barely follows through i.e., they never breach the neckline.
From the looks of it, BTC price seems to be going back down to the $10,100 level and possibly to the 10,000 level and further testing the neckline. RSI looks bearish as well, weighing in on the retest of the neckline by today’s end.


