Bitcoin

Bitcoin hinges on breakout of a symmetrical triangle: A dip to $8,500 or surge above $13,800?
Posted:

Bitcoin’s price witnessed a major drop of 14% after breaching supports in over 5 days. However, the major breach in support occurred on August 13, when the price breached $11,229. The price has since collapsed by 8% and is currently at $10,459, further indicating a bearish trend in upcoming days.
Shorter Time Frame
Bitcoin has had a great run-up since July (refer chart). The price in this timeframe rose by 30% in 8 days, following which the price consolidated into a symmetrical triangle. The breakout from this pattern caused the price to trickle down at every major support, leading to the current price. However, looking at this price action from a slightly higher time frame of 4 hours, it shows formation of 2 patterns.
Why the Drop?
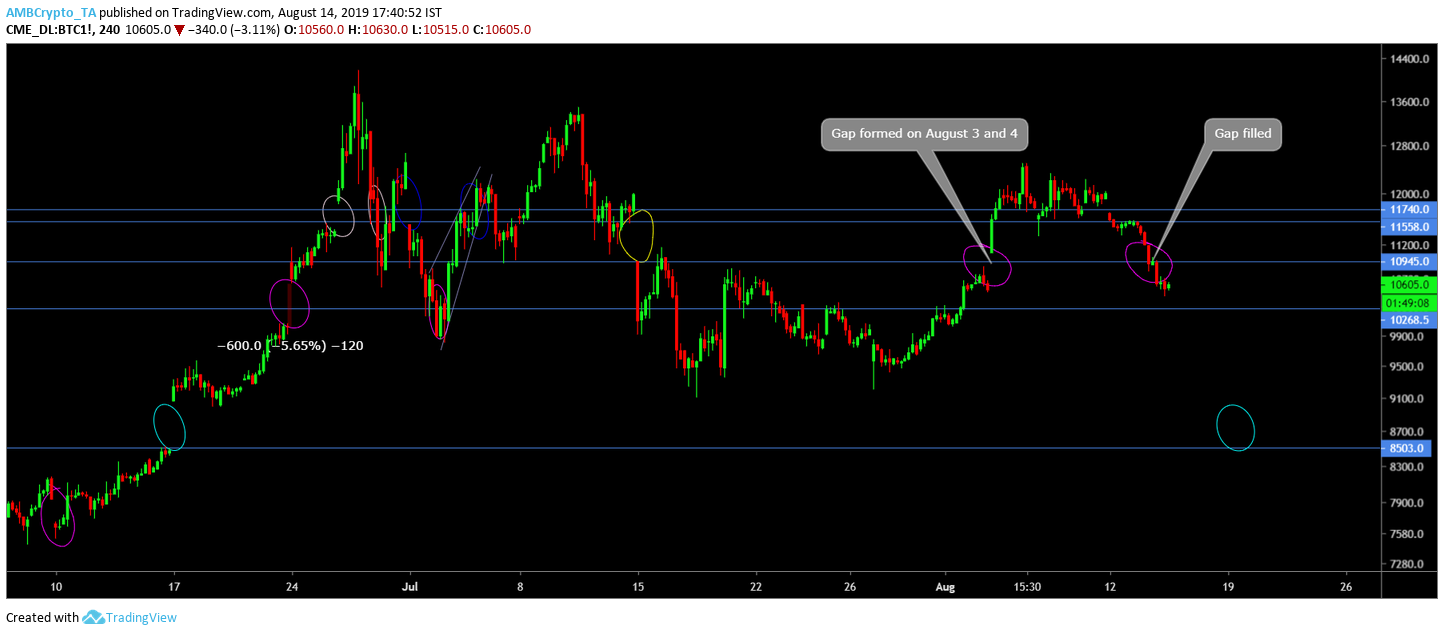
Looking at the CME chart of Bitcoin, it can be easily inferred that the price was merely filling the gap formed on August 3 and 4, between $10,665 and $11,070.
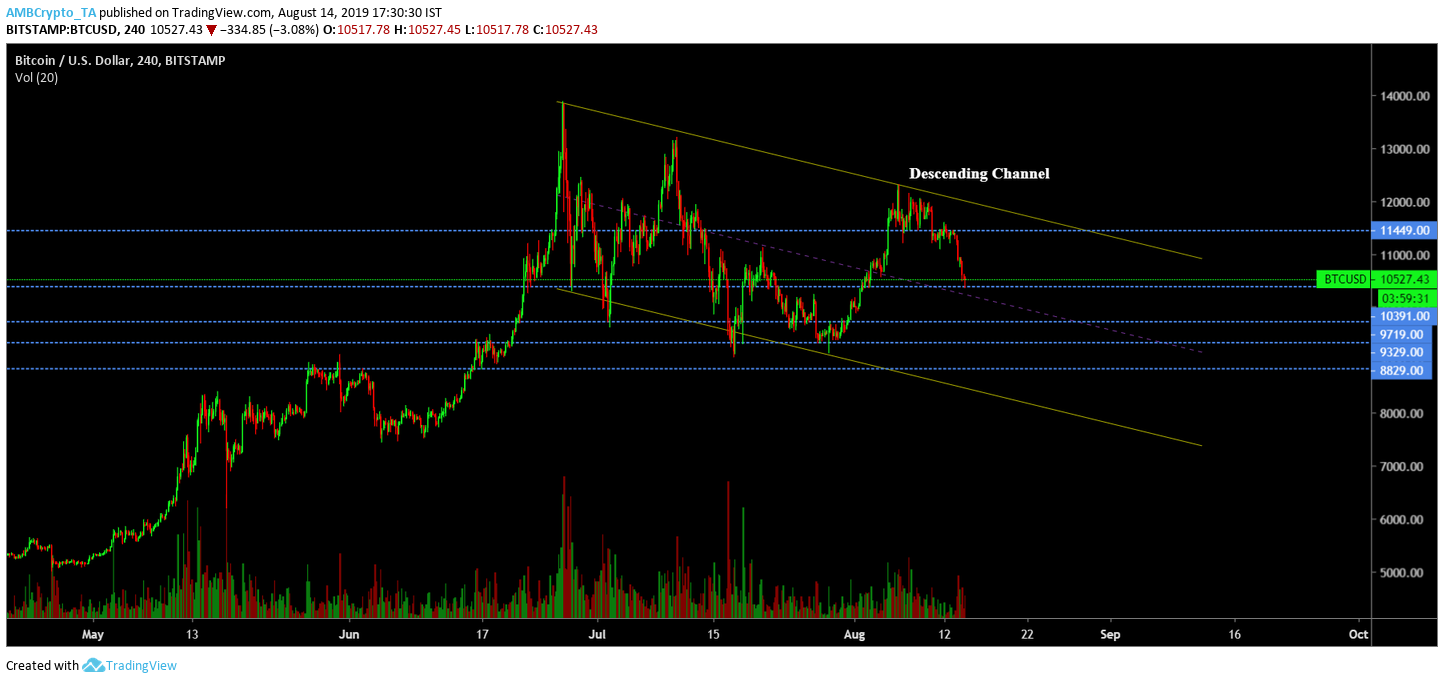
Descending Channel & Symmetrical Triangle
Source: TradingView
The Descending Channel has held for over 45 days and the price is on a downtrend and almost at center of the regression channel. Chances of price proceeding lower than $9,700 are less than likely. However, the price might easily hit $9,700 and bounce back. With this line of reasoning, likelihood of the descending channel holding up is bleak.
Adjusting the support lines, the pattern evolves into a pennant/symmetrical triangle.
Source: TradingView
This pattern would make a lot more sense as the current price action would respect the support lines as seen in the above chart. The price will continue to descend and breach support at $10,390 and reach $10,000. This would be a point of inflection for Bitcoin, a point where breakout will occur.
Direction of Breakout
Breakout direction is in limbo and could go either way, so looking at other factors would also provide a clearer picture.
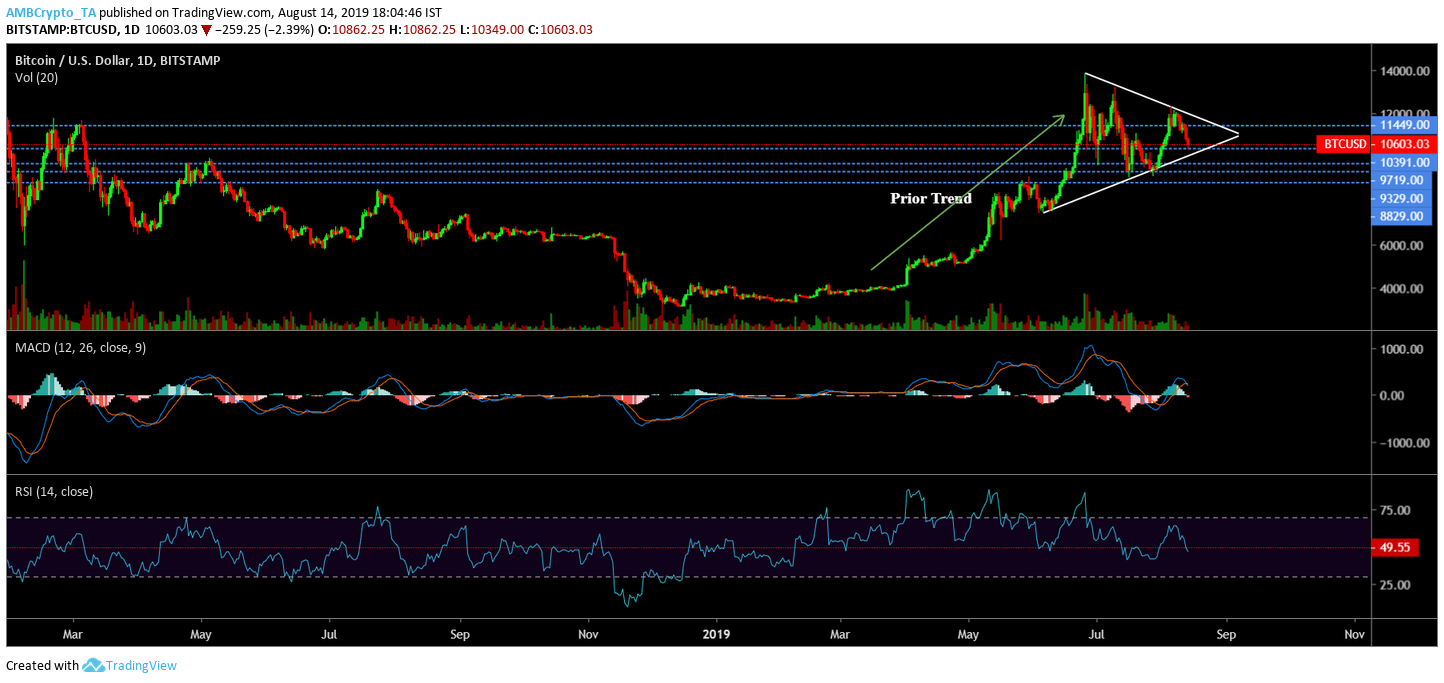
- Prior Trend: As mentioned before, price has constantly been on an uptrend; however, bullish momentum seems to have hit a ceiling and is currently consolidating. This would make it a bullish pennant, indicating breakout to the upside.
- MACD: MACD indicator shows an imminent bearish crossover.
- RSI: RSI indicator has breached an important support line which has held for more than six months.
Looking at these indicators, it is clear that there is a vivid bearish bias for Bitcoin in a short to medium timeframe.
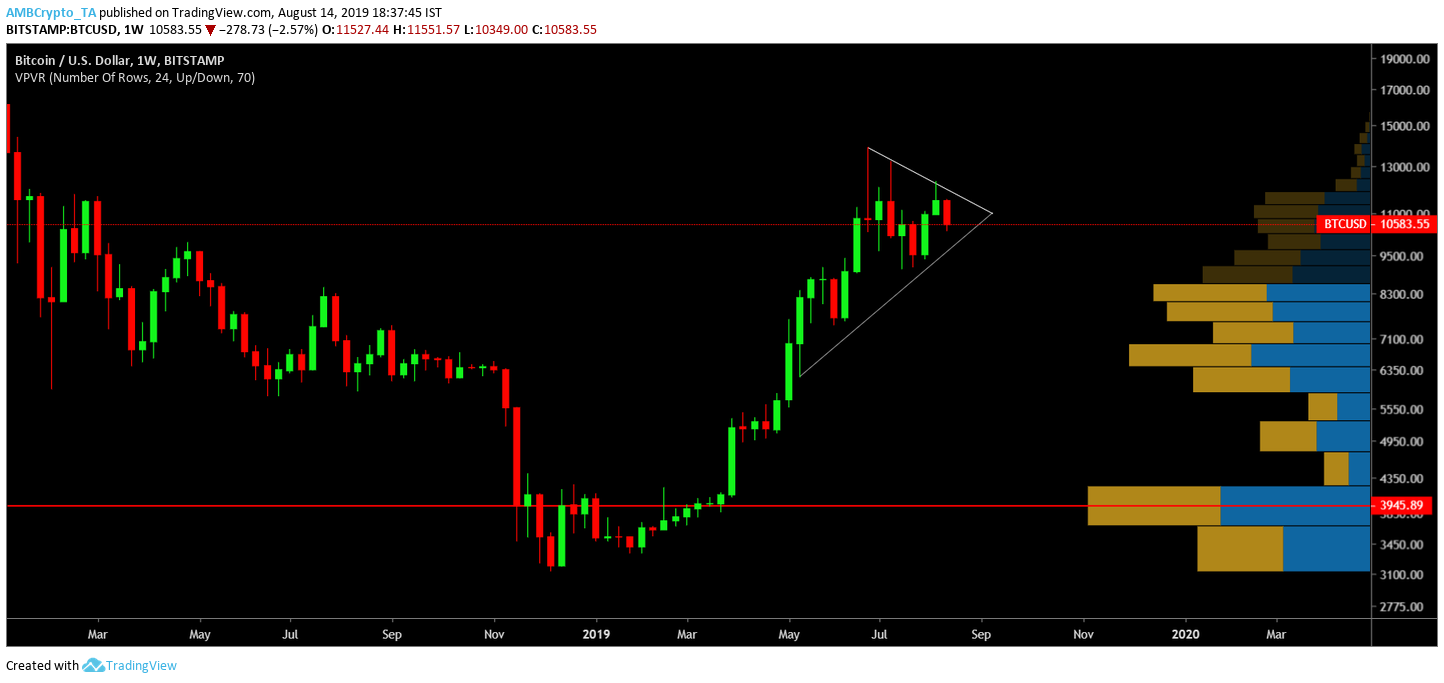
Weekly Time Frame
Source: TradingView
The weekly time frame for Bitcoin shows bleak prospect as the newly formed weekly candle has been bleeding red, at press time. There are, however, four additional days for completion of this candle, which will further confirm this bias.
A Shot in the Dark
Chart of Bitcoin has analysts flummoxed as the pennant that could break out either way. Considering bullish momentum exhaustion, price of Bitcoin, in the weekly time frame, could proceed lower – as low as $8,500.
Yes, as low as $8,500.


