Bitcoin’s golden cross changes everything for the 2020 rally

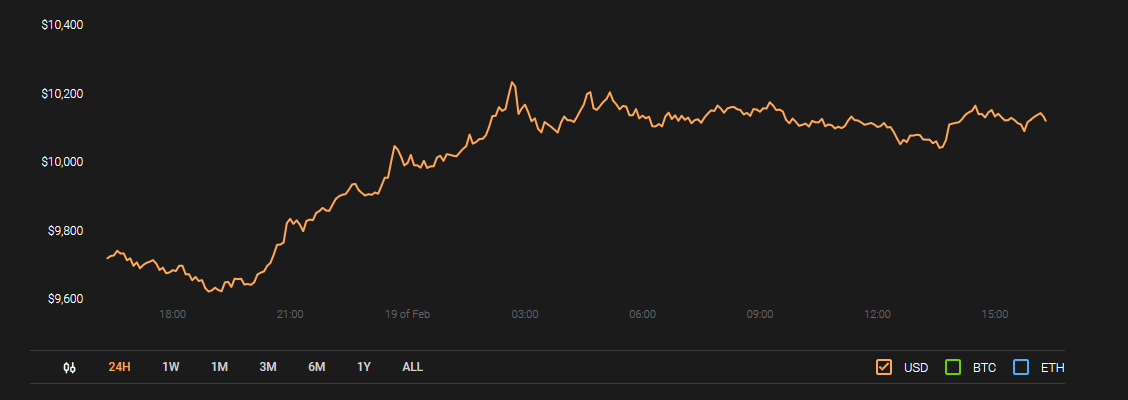
Bitcoin’s stay under $10,000 was short-lived as it picked up momentum on 17th Feb. The valuation witnessed a 6.07 percent surge, and Bitcoin re-entered the $10,000 range. Over the past 24 hours, BTC registered a 4.02 percent uptick and the current market cap remained at $184 billion.

Source: Coinstats
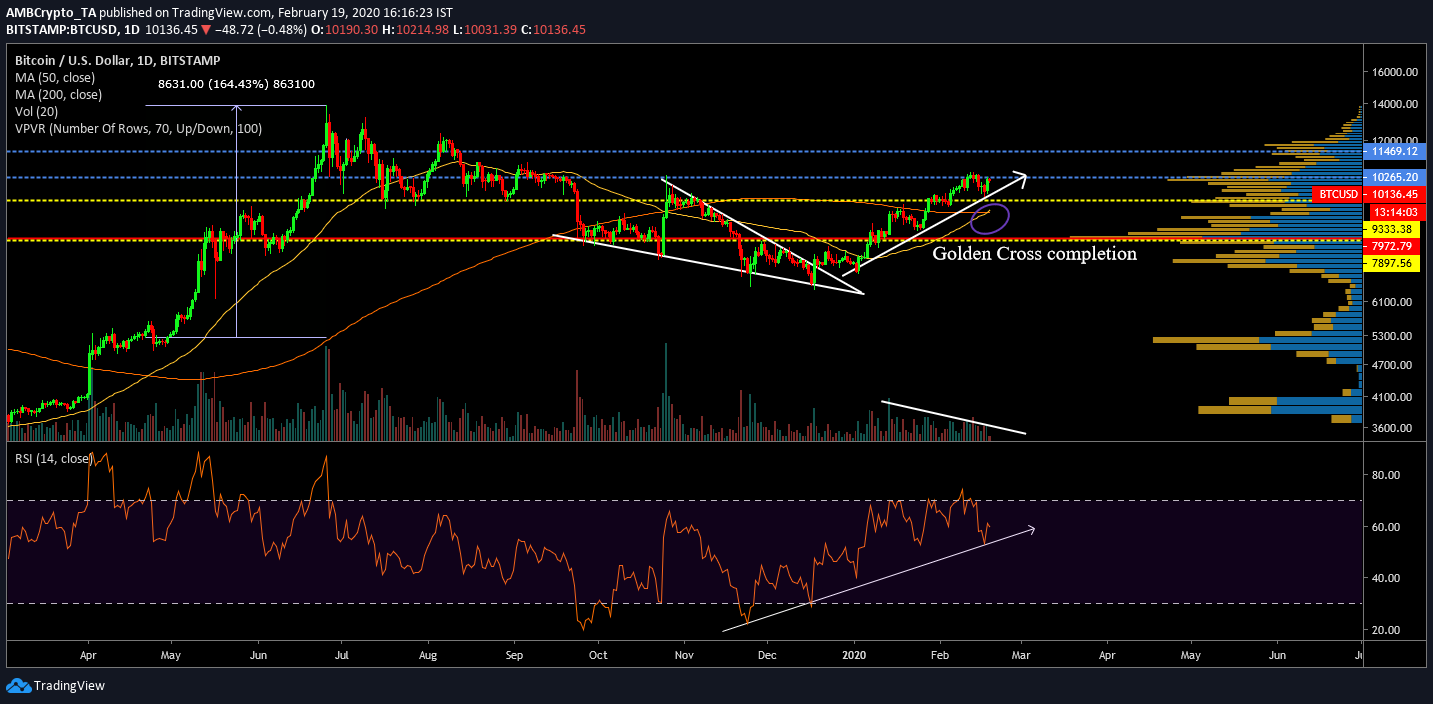
Bitcoin 1-day chart

BTC/USD on Trading View
The 1-day chart of Bitcoin has been evidently bullish since the turn of the year after the price broke out from a falling wedge pattern. The pattern started taking shape toward the end of November and a bullish breakout surfaced in the 3rd week of December. After the breakout, Bitcoin has periodically risen from $7000 to $10,000.
Until now, the bullish surge of Bitcoin has been expected to exhibit some form of correction, but besides minor dips, nothing has really impacted its rise.
At press time, Bitcoin held consolidation just under the resistance at $10265, with immediate support at $9800. However, Bitcoin may continue to progress upward now, since the highly anticipated golden cross has taken shape.
The last golden cross took place on 23rd April 2019. The positive turnaround after the cross-over was significant, as Bitcoin experienced a 164.43 percent rise, reaching last year’s ATH at $13,880. A repeat of such a trend would easily take Bitcoin above its all-time-high at $20,000.
According to VPVR indicator, trading volume at $10,200 has been strong over the past year which indicated that Bitcoin may consolidate in his range over the next week. RSI also pictured a bullish incline since the start of December.
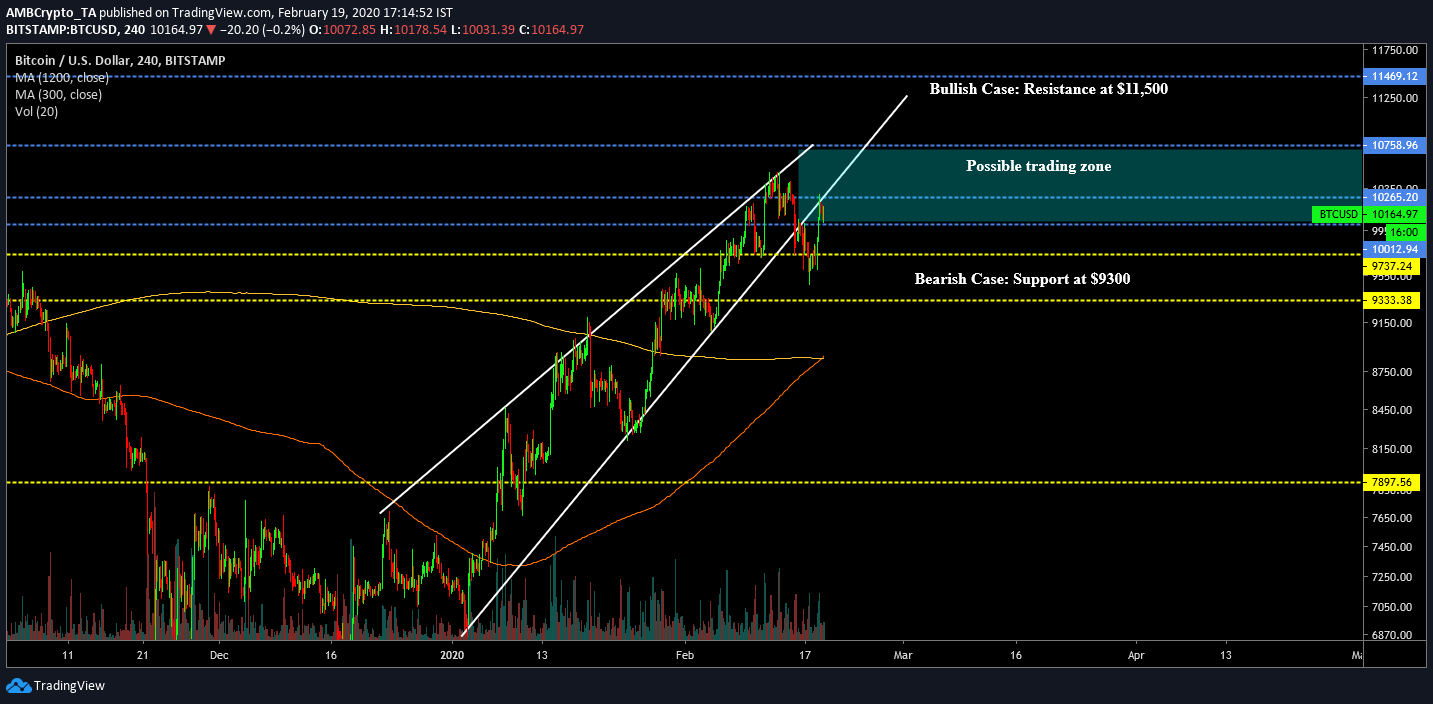
Bitcoin 4-hour chart

BTC/USD on Trading View
Analyzing the 4-hour chart of Bitcoin may give a clear indication of Bitcoin’s trading range over the next few weeks. Bitcoin’s correction on 15th February can be observed in the 4-hour chart, which transpired after the formation of a rising wedge pattern. As mentioned earlier, Bitcoin managed to recover quickly and it rose back above the $10,000 range.
If Bitcoin manages to trade above $10,265 resistance and consolidate near the $10,700 range, the possibility of a bullish rise to $11,500 could be very much on the cards.
Consolidation below $10,200 may open doors for another correction. With the completion of the golden cross, that situation seems less likely.
Conclusion
The completion of a golden cross is a positive bullish sign, which may take Bitcoin well beyond the $11,000 range over the next few weeks. With the ‘FOMO’ kicking in after the golden cross, the next few days would decide Bitcoin’s long-term price movement until the halving.


