
Despite 60% gains for XRP from the start of the year, the cryptocurrency’s dip under the $0.30 mark has investors concerned. An analysis of the 1-hour chart indicated two possible outcomes for XRP in the short-term, and it’s unclear which path the coin will take.
At the time of writing, XRP was valued at around $0.29, and CoinMarketCap reported that the coin had a market capitalization of over $12.88 billion.
XRP 1-hour chart
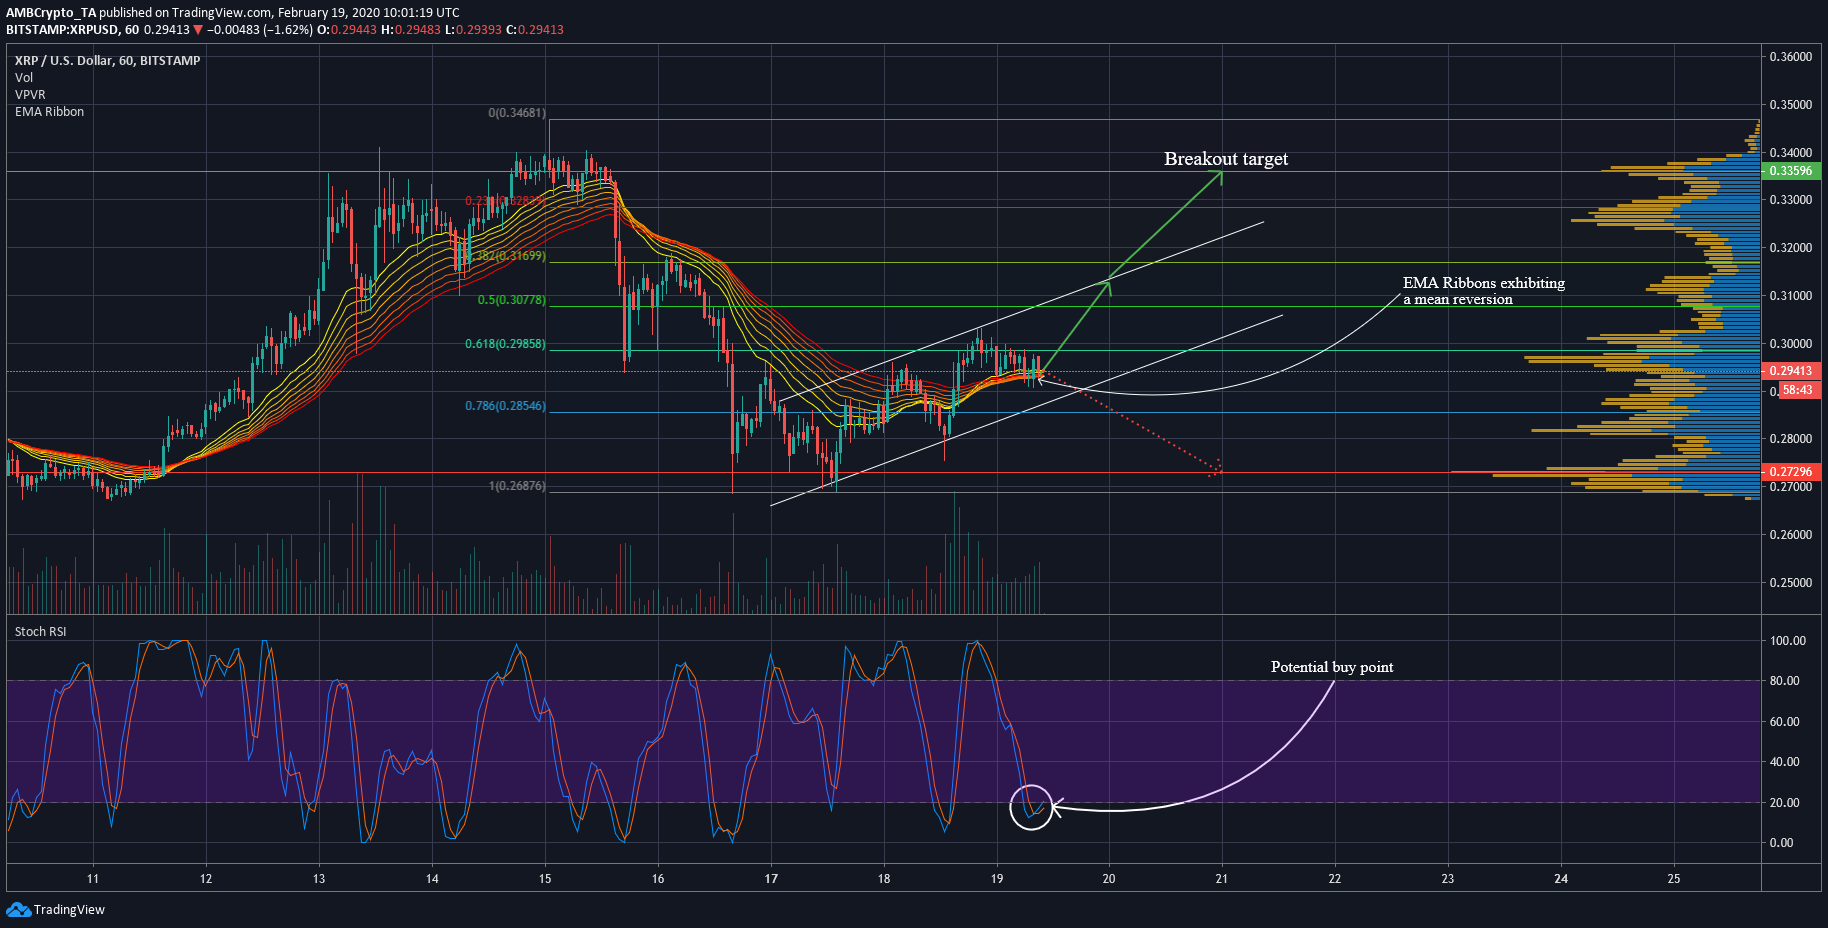
Source: XRPUSD on TradingView
Following XRP’s dive from just under the $0.35 level, the cryptocurrency looked to have entered an ascending channel formation a couple of days ago. These patterns are typically short-term bullish patterns, and could indicate some upside for XRP in the coming days. Volumes seemed to have spiked as XRP neared the lower pattern boundary, so a sudden increase in trade volume could be a reliable signal in this scenario.
As shown in the above chart, XRP had been attempting to breach the 61.8% Fibonacci retracement line. Failing to do so, it found support at the EMA Ribbon lines, which appeared to be going through a mean reversion phase. Considering how these mean reversions are usually followed by an expansion, it could influence XRP to move to the upper pattern boundary in the short-term. However, if the price were to dip under the ribbons, the expansion could facilitate a disastrous downward breakout to $0.273.
Additionally, the Stochastic RSI indicator presented a buy signal, with the two moving averages having dipped under the 20.0 mark. This has historically proven to be a reliable indicator of short-term gains, and strengthens the idea of an upward movement in the near future. This could push XRP to the breakout level between $0.31 and $0.32 in the next couple of days, followed by an upward breakout to the high-volume node region above $0.325 in the days that follow.
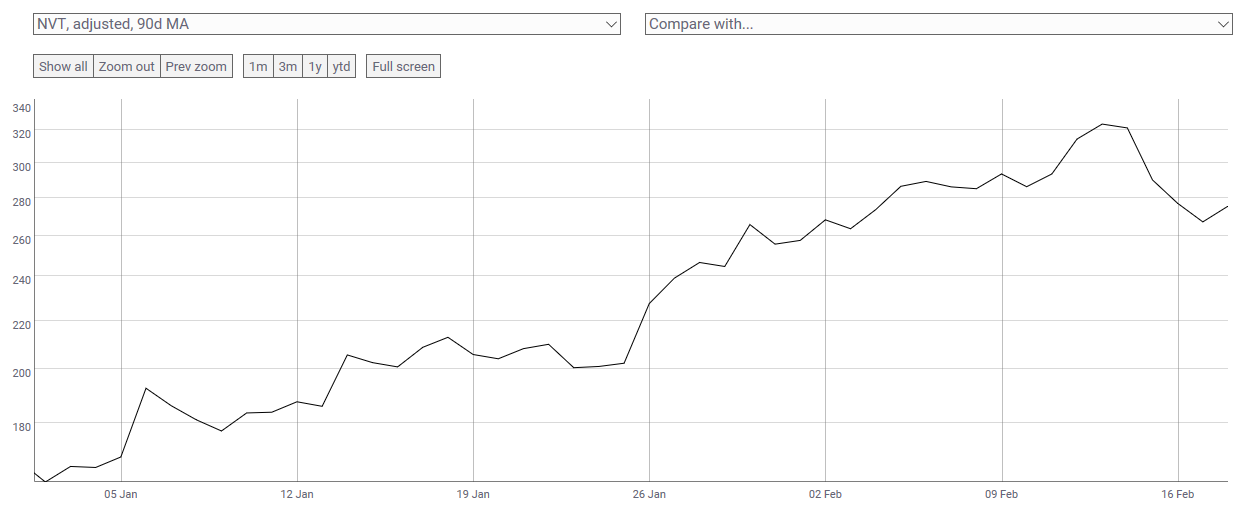
Source: CoinMetrics
Data from blockchain data analytics firm, CoinMetrics, showed that XRP’s ‘network value to (90-day moving average of adjusted) transfer value’ ratio (NVT) has been rising since the start of the year. While the NVT dipped slightly a few days ago, the overall uptrend is still prevalent.
According to Willy Woo, a high NVT ratio is a sign that the network valuation is outstripping the value being transmitted on the network. This means that the network is in a high-growth phase, and investors are valuing it as a high return investment. However, this could also signify that XRP price is in an unsustainable bubble.
Conclusion
Since ascending channels are usually bullish in the short-term, it is likely XRP will move up in value over the next few days. Considering the StochRSI indicator presented a buy signal, as well as the potential for the EMA Ribbon lines to expand from their mean reversion, XRP will probably move to the upper trend line between $0.31 and $0.32 soon. The NVT ratio also indicated the network is in a high-growth phase, which could facilitate a breakout to the $0.325 level this week.
However, if the price manages to pull under the EMA Ribbons’ support, the expansion could cause a move down the $0.272 level, and could prove XRP is in an unsustainable bubble after all.