
In the month of April, Bitcoin registered 12.82 percent growth as its valuation steadily improved from $6176 to $6975 at press time. Although the growth is commendable, it is important to analyze Bitcoin’s current market considering that volatility has decreased over the past two weeks.
1-day chart of Bitcoin
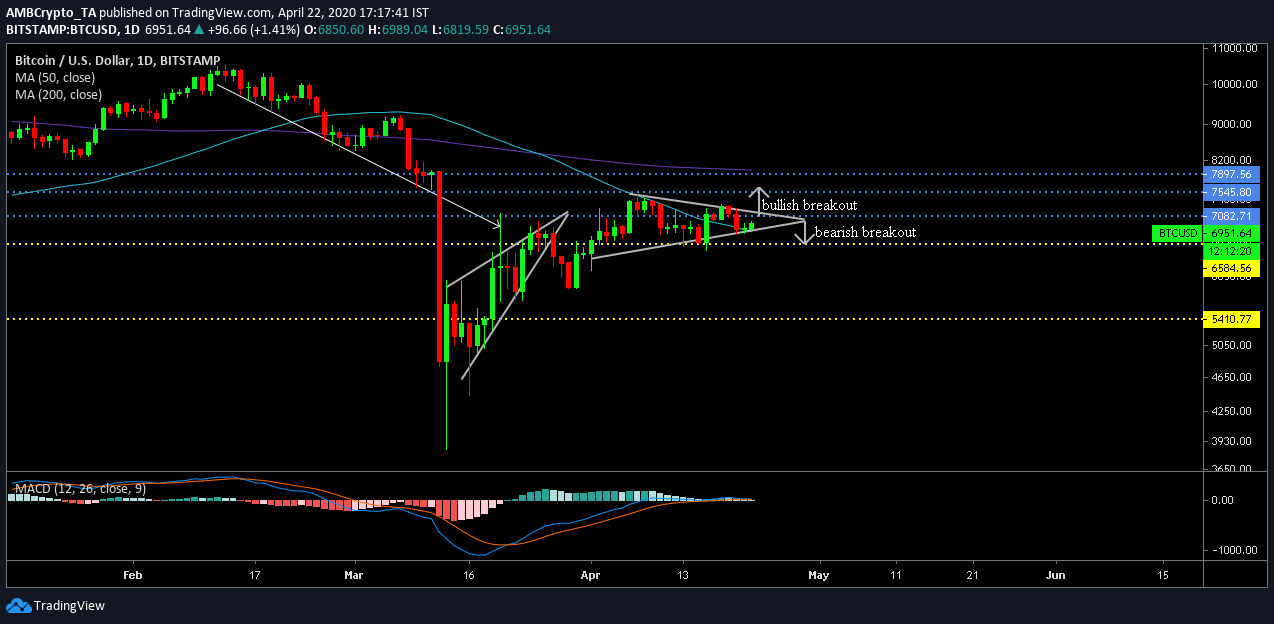
BTC/USD on Trading View
Since the 12th March decline, Bitcoin’s movement has been the subject of two price patterns. From 13th March to 27th March, the coin exhibited a rising wedge pattern which was breached on the 27th. The coin went under a bearish pullback of 14.79 percent till 30th March. After a series of corrections, Bitcoin began to climb again and over the past two weeks, the asset has formed a symmetrical triangle.
A symmetrical triangle indicates a 50 percent chance for both a bullish or bearish breakout, and since 2nd April, Bitcoin has been consolidating between $6600 and $7400.
In the case of a bullish breakout over the next week, the asset should re-test resistance at $7562, however, due to lack of significant bullish momentum, Bitcoin may not maintain a position above the range. On the other hand, another period of correction should see Bitcoin drop down to support at $6584.
At press time, MACD remained bullish but maintained close proximity to the signal line, indicating the possibility of a trend reversal.
4-hour chart of Bitcoin
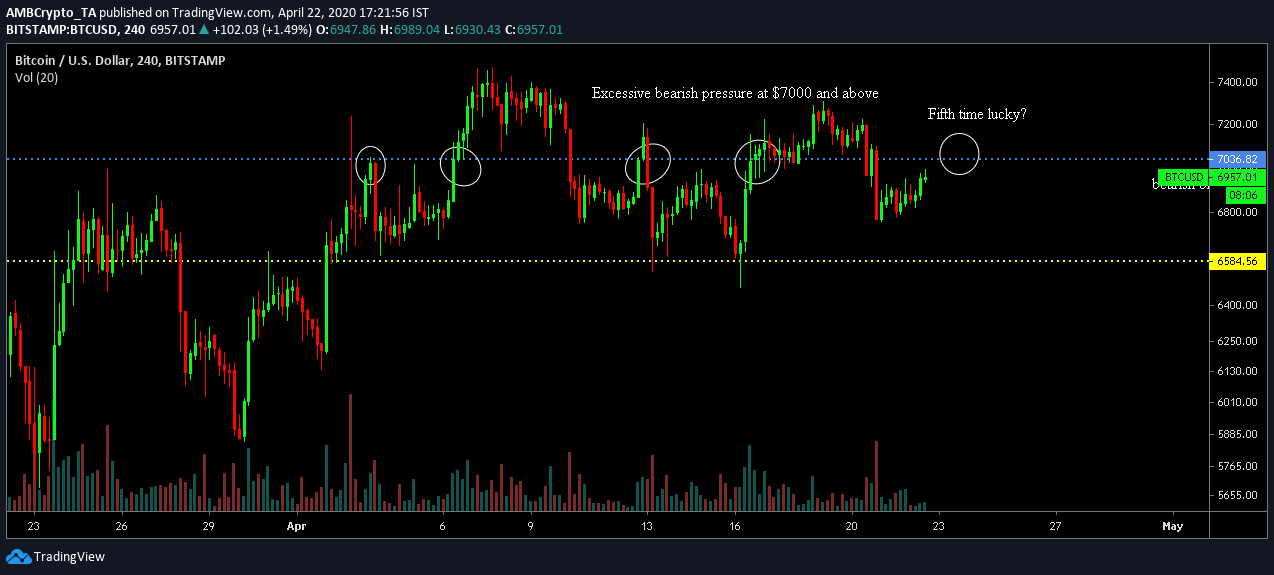
BTC/USD on Trading View
The 4-hour chart is where Bitcoin’s movement gets interesting. Bitcoin’s price spiked rapidly till the start of April but since then, it hasn’t been able to go above $7200-$7500. It can be observed that Bitcoin has tested $7003 resistance four times and at the moment, it is aiming for a fifth.
Although there are no direct bearish traits connected to such movements, it has indirect bearish implications. The repeated re-test at $7003 meant the overhead resistance is significantly high for Bitcoin. Such a scenario could potentially exhaust buying pressure.
A drop in buying pressure has not surfaced yet but another failed attempt to cross $7000-$7200 before the start of April could be detrimental.
Conclusion
Bitcoin is primed to cross $7500 by the end of April but the overhead resistance is very strong. The 50-moving day turning into support at press time is a positive sign, but the picture will be more clearer over the next two weeks.


