
Disclaimer: The findings of the following article should not be taken as investment advice, with the same deduced based on the immediate price activity of Bitcoin amidst strong bearish pressure in the market
Between 25 August and 2 September, Bitcoin managed to re-test its support level at $11,150 thrice, with the resistance level at $12,000 met only once. If you scale back the timeline, it can be observed that $12,000 has been more like a ‘pullback curse’ since whenever BTC has tested the $12k waters, it has been dragged down to the abyss below $11,200.
With concerns regarding the exhaustion of buying pressure rising, Bitcoin is possibly treading a very thin layer of ice. At press time, Bitcoin was valued at $11,400 with a market cap of $210 billion.
Bitcoin 1-hour chart
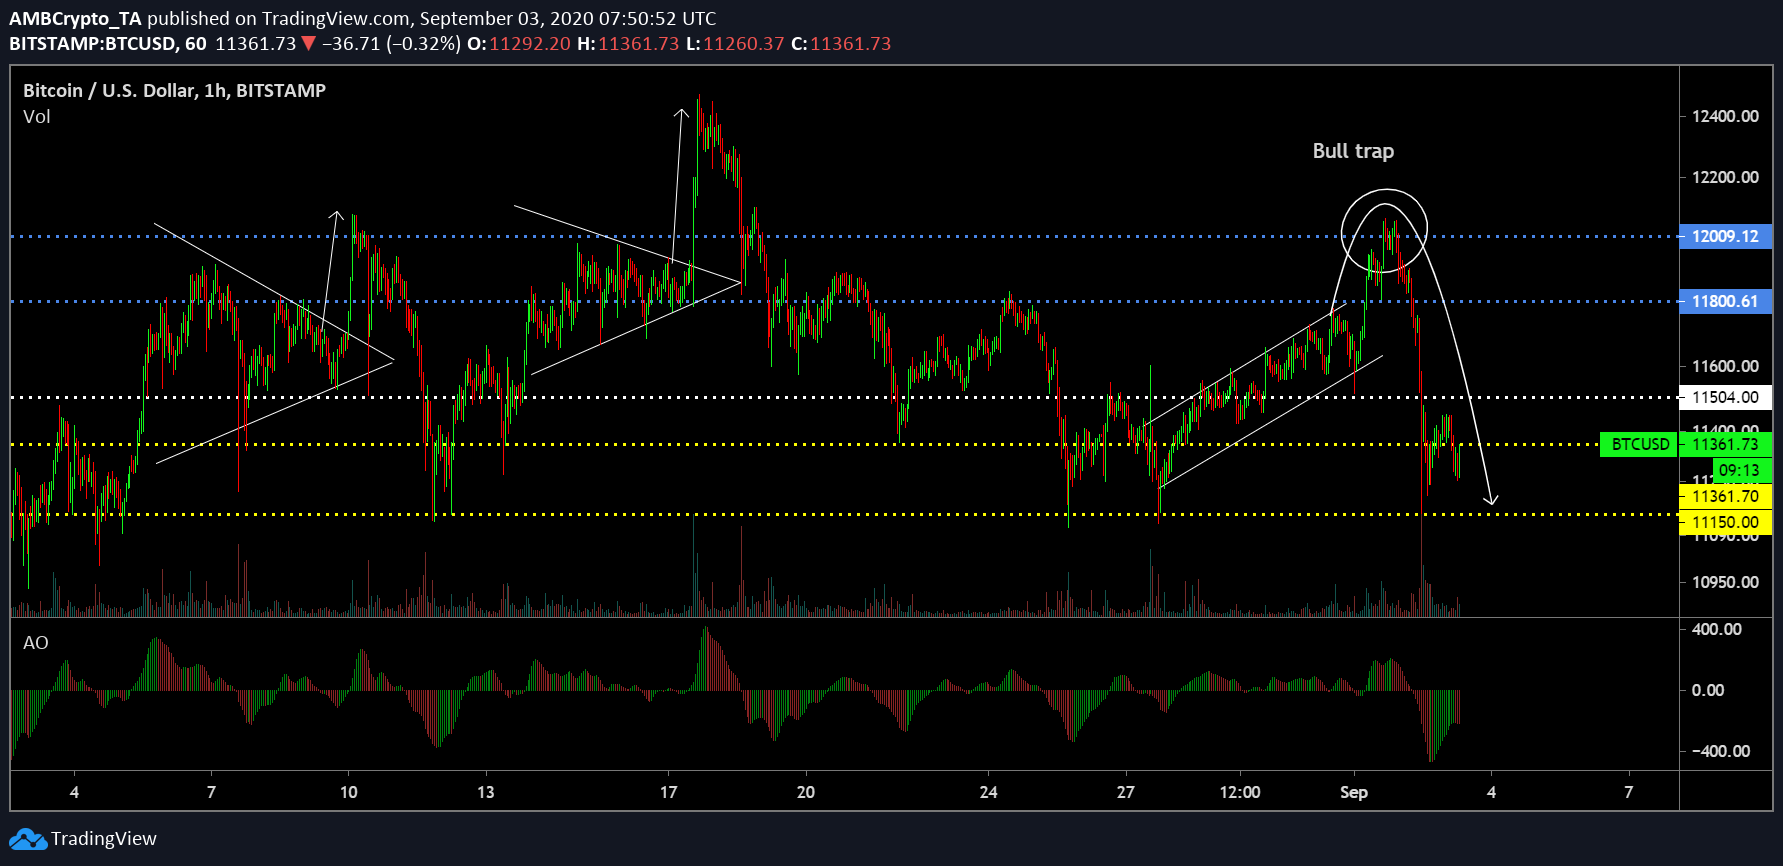
Source: BTC/USD on TradingView
As highlighted above, the $12,000-mark was tested regularly over the month of August, but the red flags were all over the place with the latest one on 1 September. Previous breakouts on the charts had taken place following the formation of a symmetrical triangle, a formation which usually carries bullish implications. Further, the Awesome Oscillator also pointed to a dip right before the breakout, pointing towards a proper bullish reversal.
The breakout on 1 September was carried out on the back of an ascending channel, one which popularly carries bearish consequences. The momentum noted right before the breakout was also inconsistent, carrying with it a sense of uncertainty. Hence, the surge towards $12,000 was met by market traders with suspicions of a bull trap, following which, BTC dropped significantly by $850 within just 12 hours.
Such a bull trap may trigger exhaustion of buying pressure in the short-term, making it difficult to configure a quick recovery on the charts.
Bitcoin 30-min chart

Source: BTC/USD on TradingView
Bitcoin’s 30-min chart will allow BTC proponents to be a little hopeful, but things may take a bearish turn from here on as well. As exhibited, BTC’s press time consolidation between $11,361 and $11,504 has been observed in the past as well, with BTC being able to push its way to above $11,500.
However, carrying the philosophy of ‘once bitten, twice shy’ in the market, there is a significant chance that BTC may not cross $11,500 while sustaining further oscillation under $11,361 over the coming weeks.
Finally, the Relative Strength Index or RSI registered its largest drop on 2 September, underlying the damage of Bitcoin’s recent collapse. Over the next few days, the trend will be clearer in terms of giving the market a better outlook for the next couple of weeks.


