
Disclaimer: The findings of the following article are the sole opinion of the writer and should not be considered investment advice
Bitcoin looked bullish on the charts, with its price hitting $13,300. The cryptocurrency’s price movement meant that it was only 32% away from the top. It should be noted, however, that in many currencies, the price had managed to cross this ATH already. Only a matter of time before it does in USD too.
At press time, however, on the shorter timeframes of 1-hour and 4-hour, the price didn’t look so bullish. In fact, it seemed the opposite. The following analysis takes a look at the possible path(s) that Bitcoin might follow.
Bitcoin 1-hour timeframe
Source: BTCUSD on TradingView
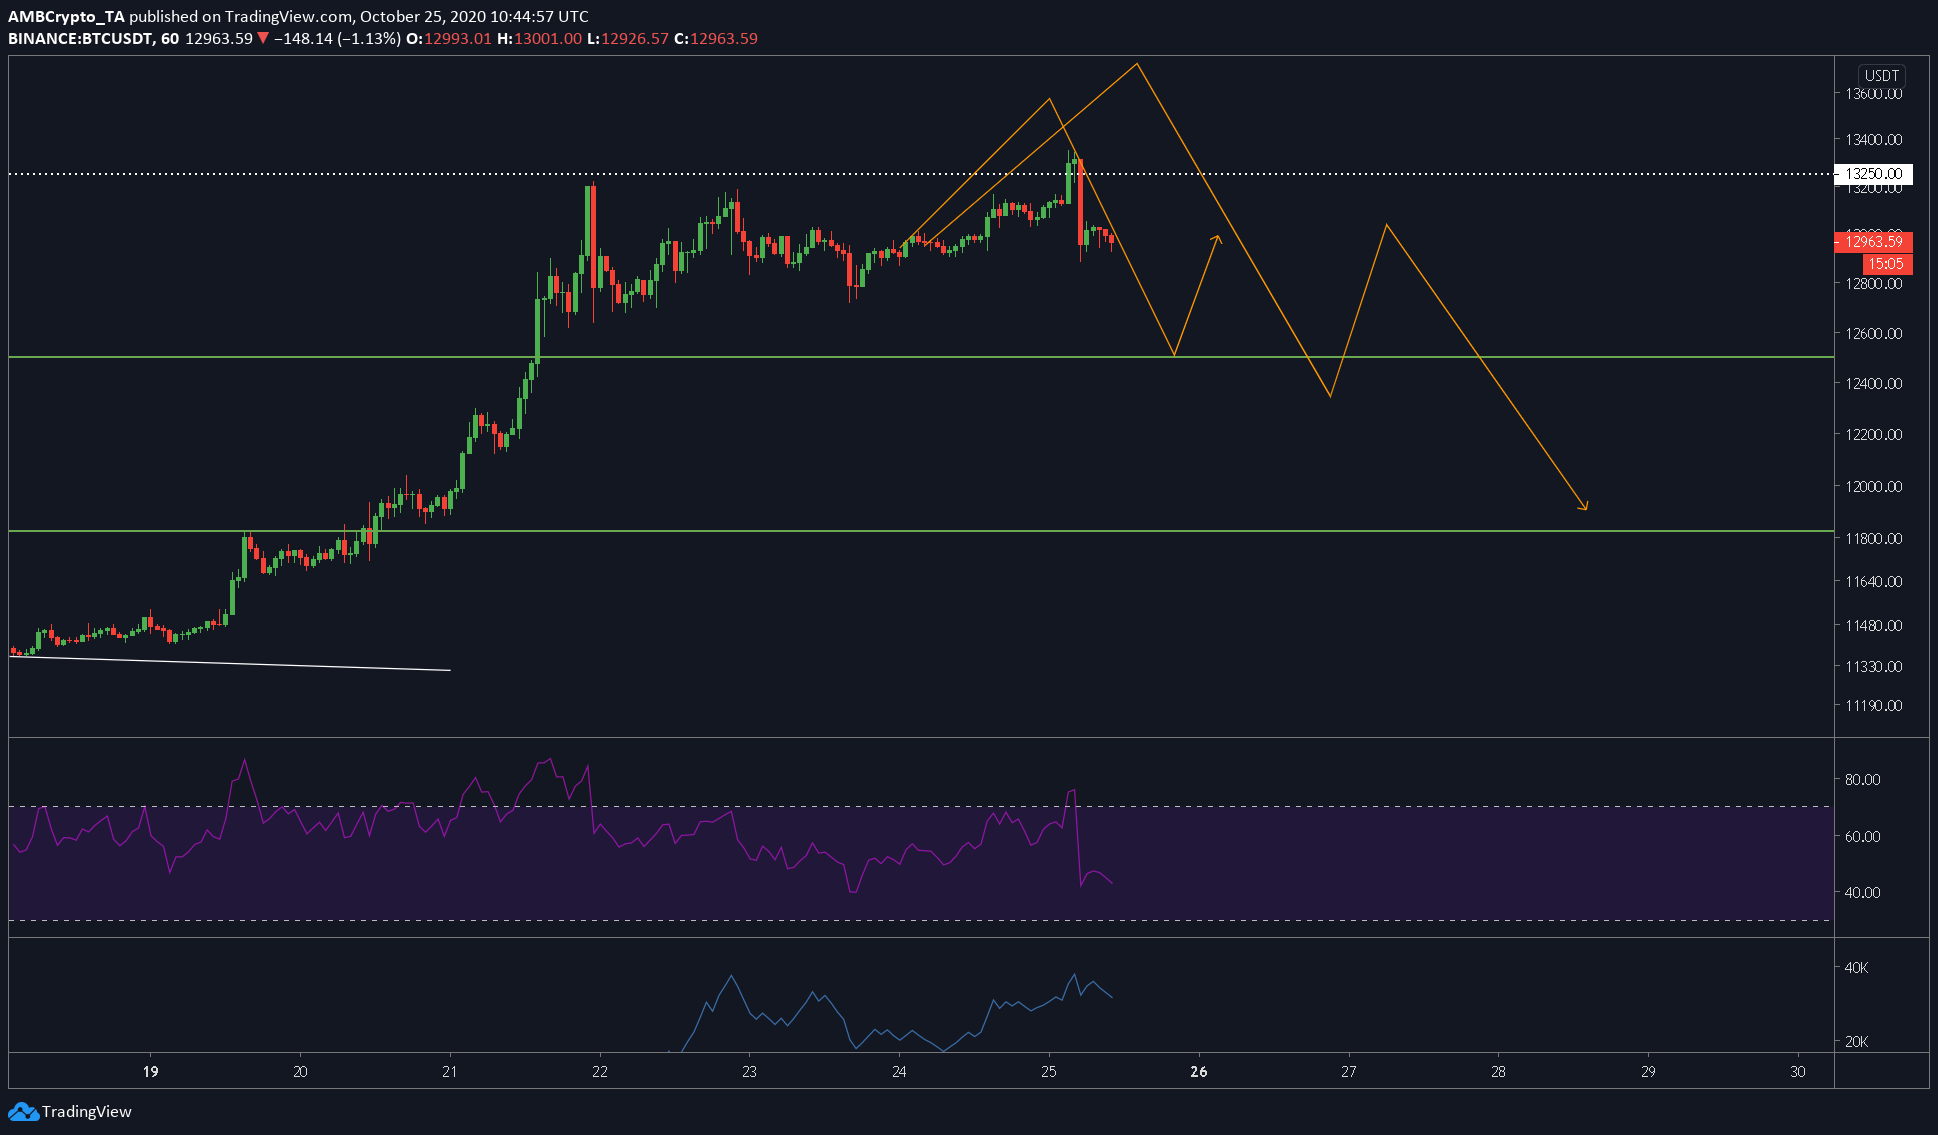
The attached chart underlined a clear view of the price over an hourly timeframe. BTC’s price didn’t seem to be doing much, apart from moving sideways on the chart. While the sell-off of ~3.5% did cause a lot of altcoins to drop as well, it was merely ephemeral.
Although there isn’t a clear bias, the run-up to the $13,000-level seems like a stretch, hence, expecting a retracement here would be the best way to go about it. Bulls need some time to recuperate, hence, the bias would be short.
Based on this, the attached chart highlighted two possible ways by which Bitcoin might proceed. Both pointed to the price heading lower, the first one more conservative and respectful of the supports/resistance levels, while the second one indicating the market bears going wild. It should be noted, however, that the latter would still be a correction and not a sell-off.
Rationale and levels to look out for
The main rationale is as explained above, however, looking at the hourly chart, the RSI showed that it was overbought until today’s sell-off. Hence, we can expect the price to head lower on the shorter timeframe. On the medium-term timeframe too, we can expect sideways movement and/or correction, at least until we hit $12,500.
In dire circumstances, we can also expect the price to correct to $11,800.
Since between the RSI and the price, there is a bearish divergence, this will only add to the already existing bearish pressure in the market.


