
After being rejected under the $11,000-mark, the last 48-72 hours have seen Bitcoin survive a period of bearish turmoil. With the cryptocurrency’s price consolidating near $10,300 at press time, some degree of recovery was observed on the charts. However, the resistance at $10,412 continued to hold out. A look at Bitcoin’s charts revealed that a period of high volatility may be incoming for the world’s largest cryptocurrency.
Bitcoin 1-hour chart
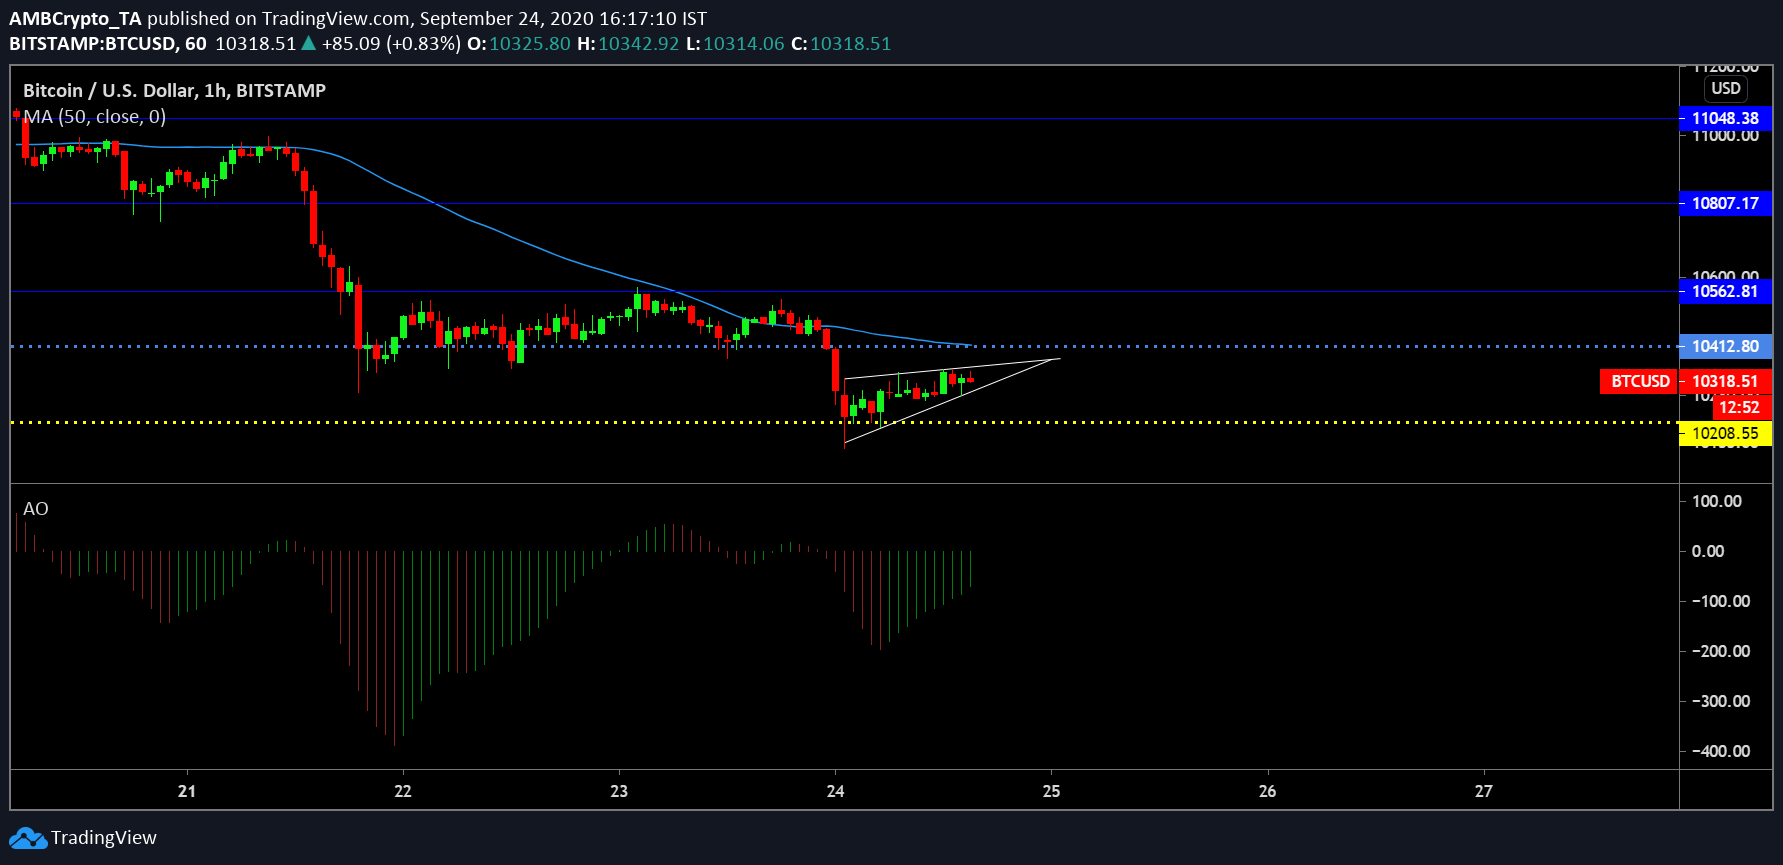
Source: BTC/USD on Trading View
The 1-hour chart for Bitcoin, particularly, pictured a rising wedge pattern, at the time of writing. However, the chances were that the pattern will not hold true in terms of a breakout over the next few hours. Following the drop at $10,200, it is more likely that the valuation will exhibit more sideways movement and possibly re-test the resistance levels at $10,412 and $10,562.
The 50-Moving Average needs to be considered with respect to being a strong overhead resistance, but a quick burst in buying pressure can lift the crypto’s price well above the Moving Average. Further, the Awesome Oscillator indicated that despite the presence of bullish momentum, it wasn’t enough to affect a reversal on the charts.
Bitcoin 2-hour chart
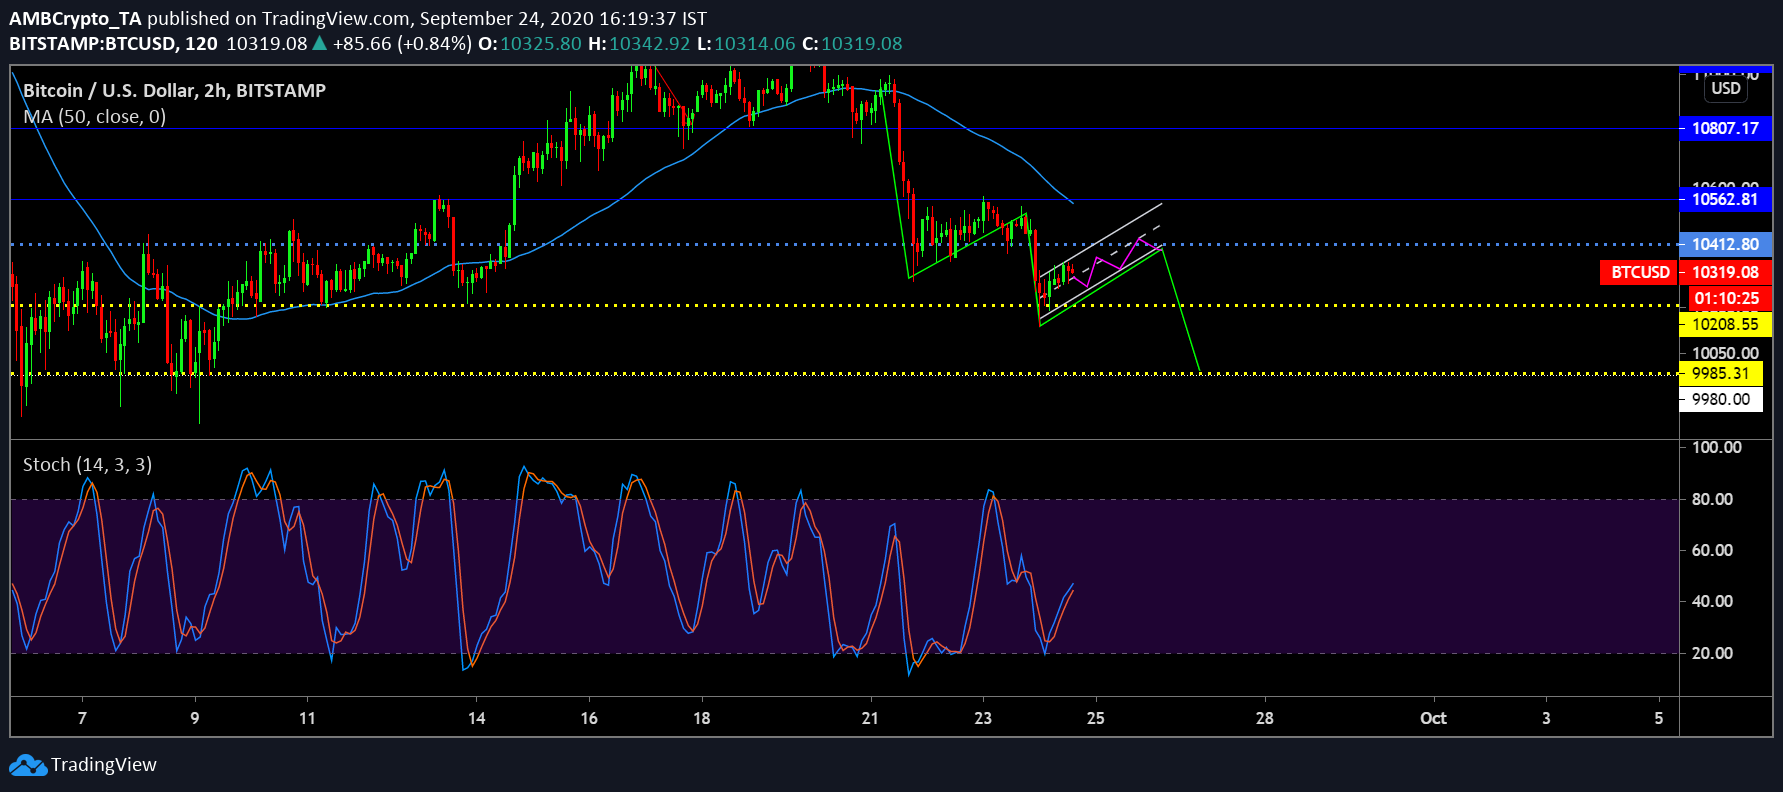
Source: BTC/USD on Trading View
While the 1-hour chart was riddled with confusion, more clarity was seen on the 2-hour chart. The two-hour chart explained the possible market structure for Bitcoin’s movement over the coming days, rather than plotting an accurate price movement. As observed in the attached chart, the market structure was hardly broken, at the time of writing, with Bitcoin possibly going to move between the parallel channel before registering another flash crash to the support level at $9980.
The transition might not follow exactly with respect to the green line, but structurally, a re-test at $9980 before another leap north should be expected.
The Stochastic RSI was completely bullish in the short-term, hence, the price can rise to $10,560, before heading south. After reaching its peak, the orange line should undergo a bearish crossover at the overbought position as the selling pressure takes over once more.


