
Disclaimer: The findings of the following analysis should materialize by the end of July
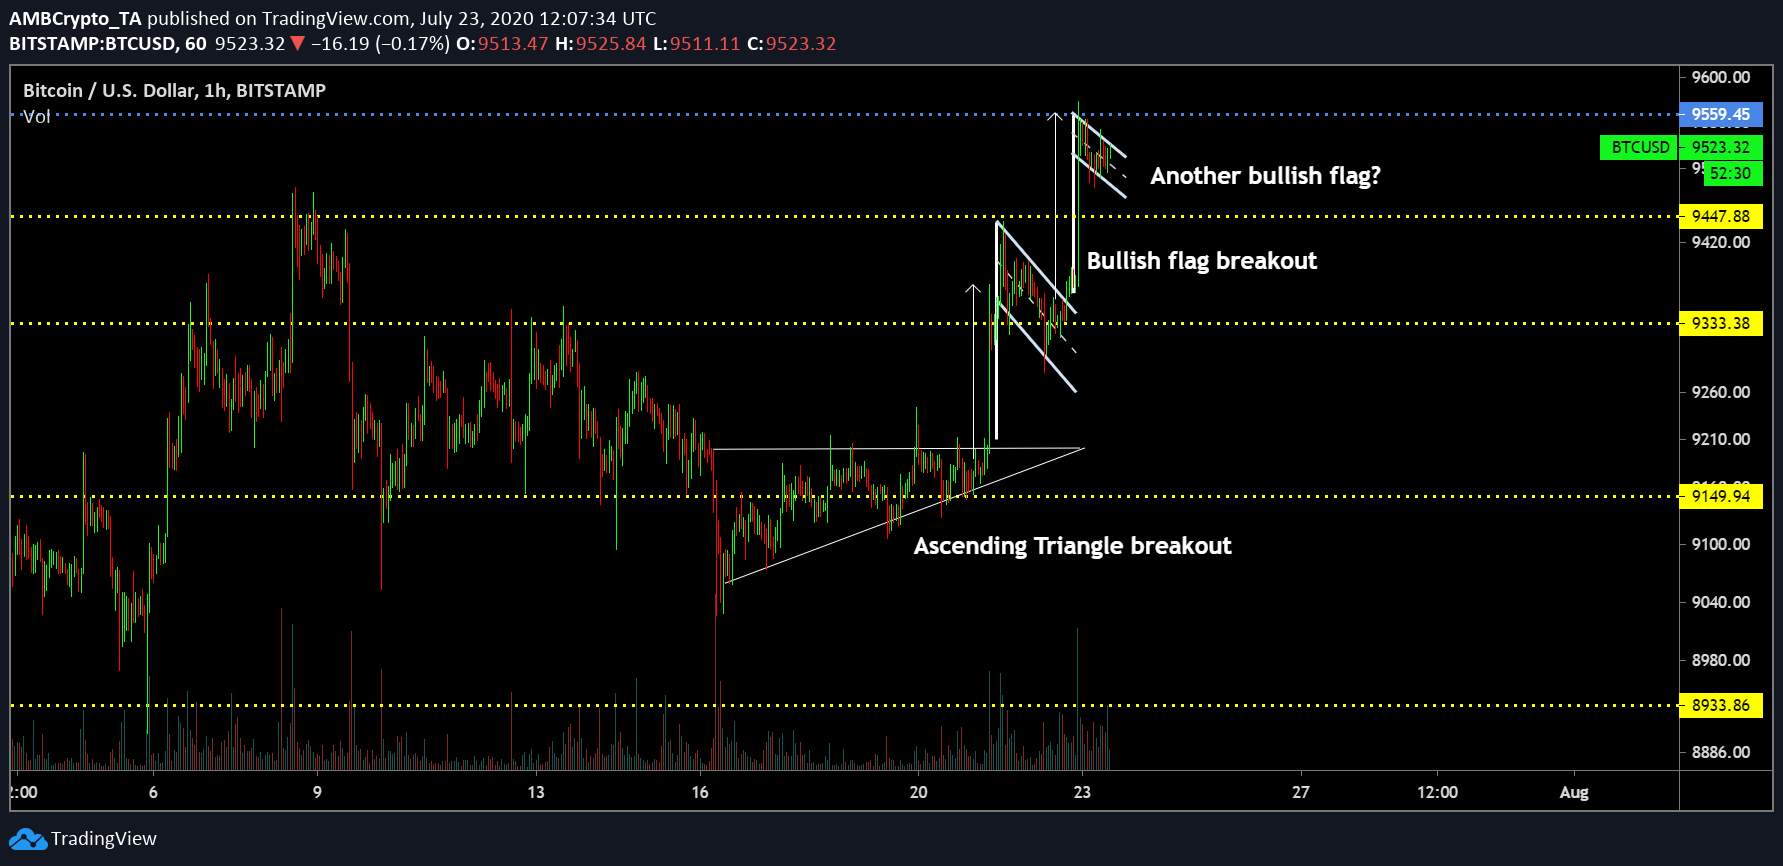
After 6 weeks of steady consolidation and reduced volatility, Bitcoin is finally registering some movement on the price charts as it breezed past multiple resistances. After the crypto-asset’s exploits on 21 July, Bitcoin consolidated above $9333 for 24-hours, following which another rally proceeded. The latest price surge took Bitcoin above its immediate resistance at $9447, following which there was a brief re-test at $9559 after almost 5 weeks.
With volatility fairly evident, the crypto-asset continues to demonstrate a sense of uncertainty.
Bitcoin 1-hour chart
Source: BTC/USD on Trading View
After its collapse on 16 July, Bitcoin’s bullish breakouts can be broken down into three different patterns from the attached short-term chart. The first move upwards came after an ascending triangle that was formed during the recovery phase following the Twitter Hack. The first rally allowed Bitcoin to breach $9333. With many expecting immediate corrections, the pullback was minimum as the price gave rise to a bullish flag pattern, leading to the most recent breakout.
Accompanied by strong buying pressure, BTC comfortably breached $9,400 for the first time since 22 June and made its way to the next resistance at $9559. Bitcoin supporters will be delighted with the fact that at the time of writing, the crypto-asset exhibited another bullish flag pattern.
Hence, another rally cannot be taken out of the picture, one that may allow Bitcoin to surge above $9559 for the first time since the beginning of June.
Bearish possibility
Source: BTC/USD on TradingView
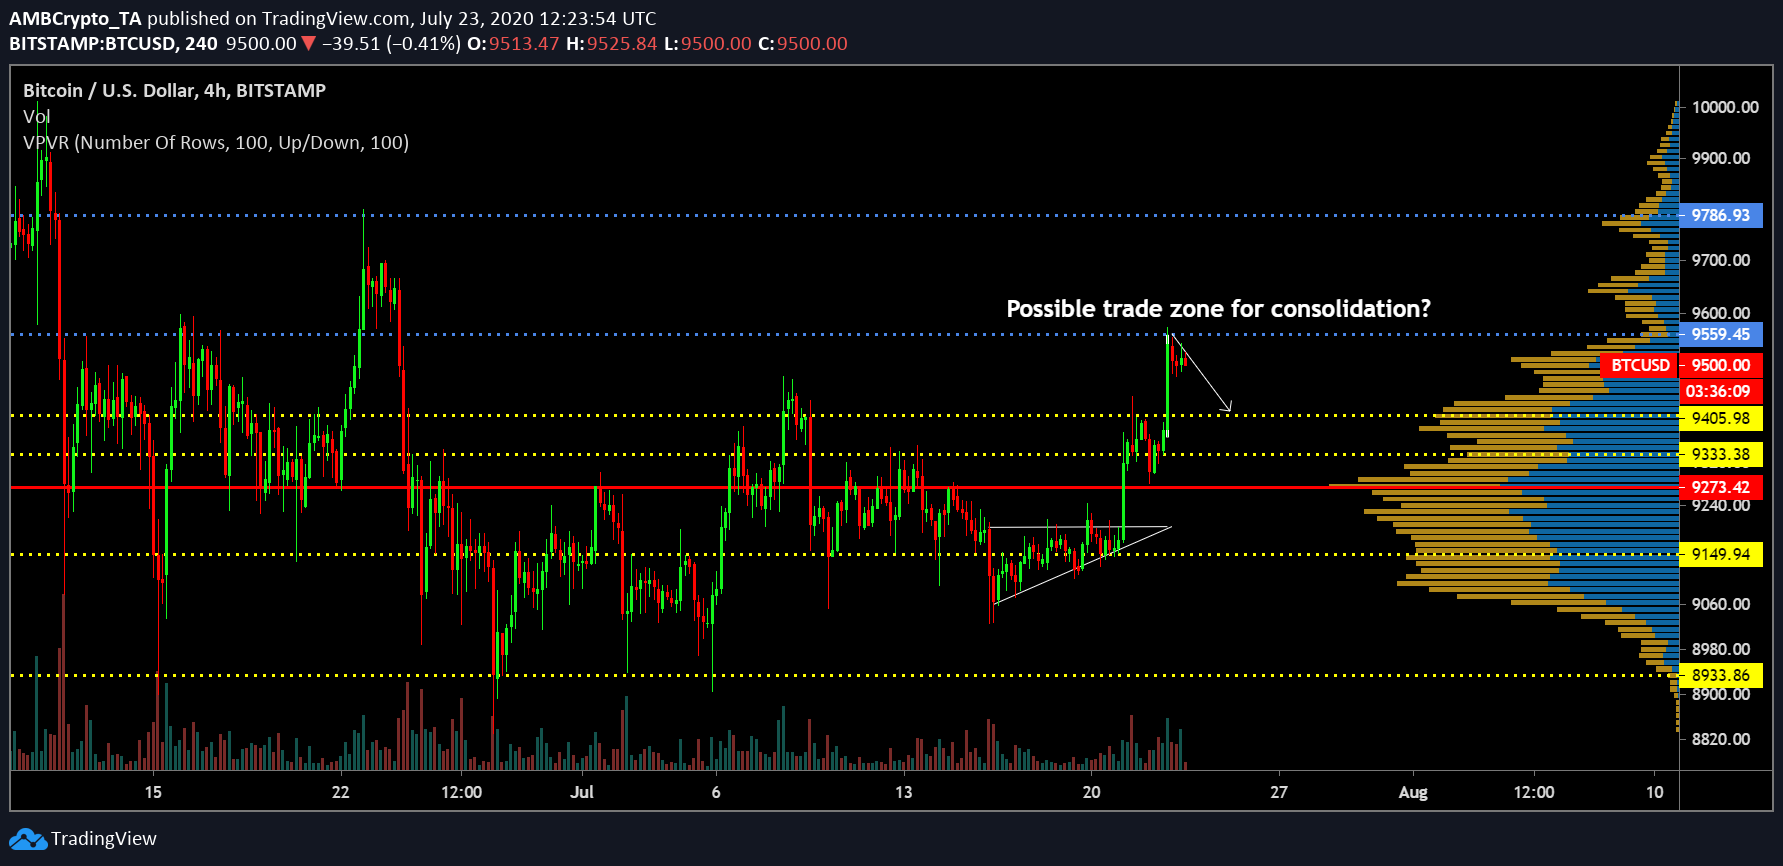
Now, a period of correction can never be disregarded after such a bullish movement. Hence, it is distinctly possible that the crypto-asset may remain between $9405 and $9559 for the next few days.
A cool-down period under partial bearish pressure will allow the asset to maintain its position above the immediate support at $9405, a development that will be a positive sign in the long-run.
Further, the VPVR suggested minor trading at the press time price range. Hence, a drop down to $9405 cannot be taken out of the picture.
Bearish repetition may sour performance

Source: BTC/USD on TradingView
Now, in spite of the resurgence, the recent rally was not something unseen over the past couple of weeks. The attached chart suggested a similar trading path during the 2nd week of July, and if the historical movement is anything to rely on, a massive sell-off is possibly on its way.
The Relative Strength Index or RSI, at the time of writing, was in the overbought range. Hence, it is bound to register some form of pullback, and the immediate retracement could be down to 56. That is a significant climbdown, which will more or less pullback BTC below $9400 as well as probably all the way down to $9333. Hence, the price movement over the last week of July is going to be intriguing for BTC supporters as the charts currently favor the bears more than the bulls.
Conclusion
In spite of a bullish pattern, BTC is expected to register some sort of pullback, but the retracement range is uncertain.


