
Disclaimer: The findings of the following article are the sole opinion of the writer and should not be taken as investment advice
After testing the resistance level at $11,731 on 13 October, the prevailing market trend took the world’s largest cryptocurrency well below $11,500. While the movement in question should have been minor, later corrections took BTC down to $11,316, at press time. Although the larger trend seemed bullish, bearish concerns were slowing rearing their head too, with a few historical signs picking up as well.
Bitcoin 4-hour chart
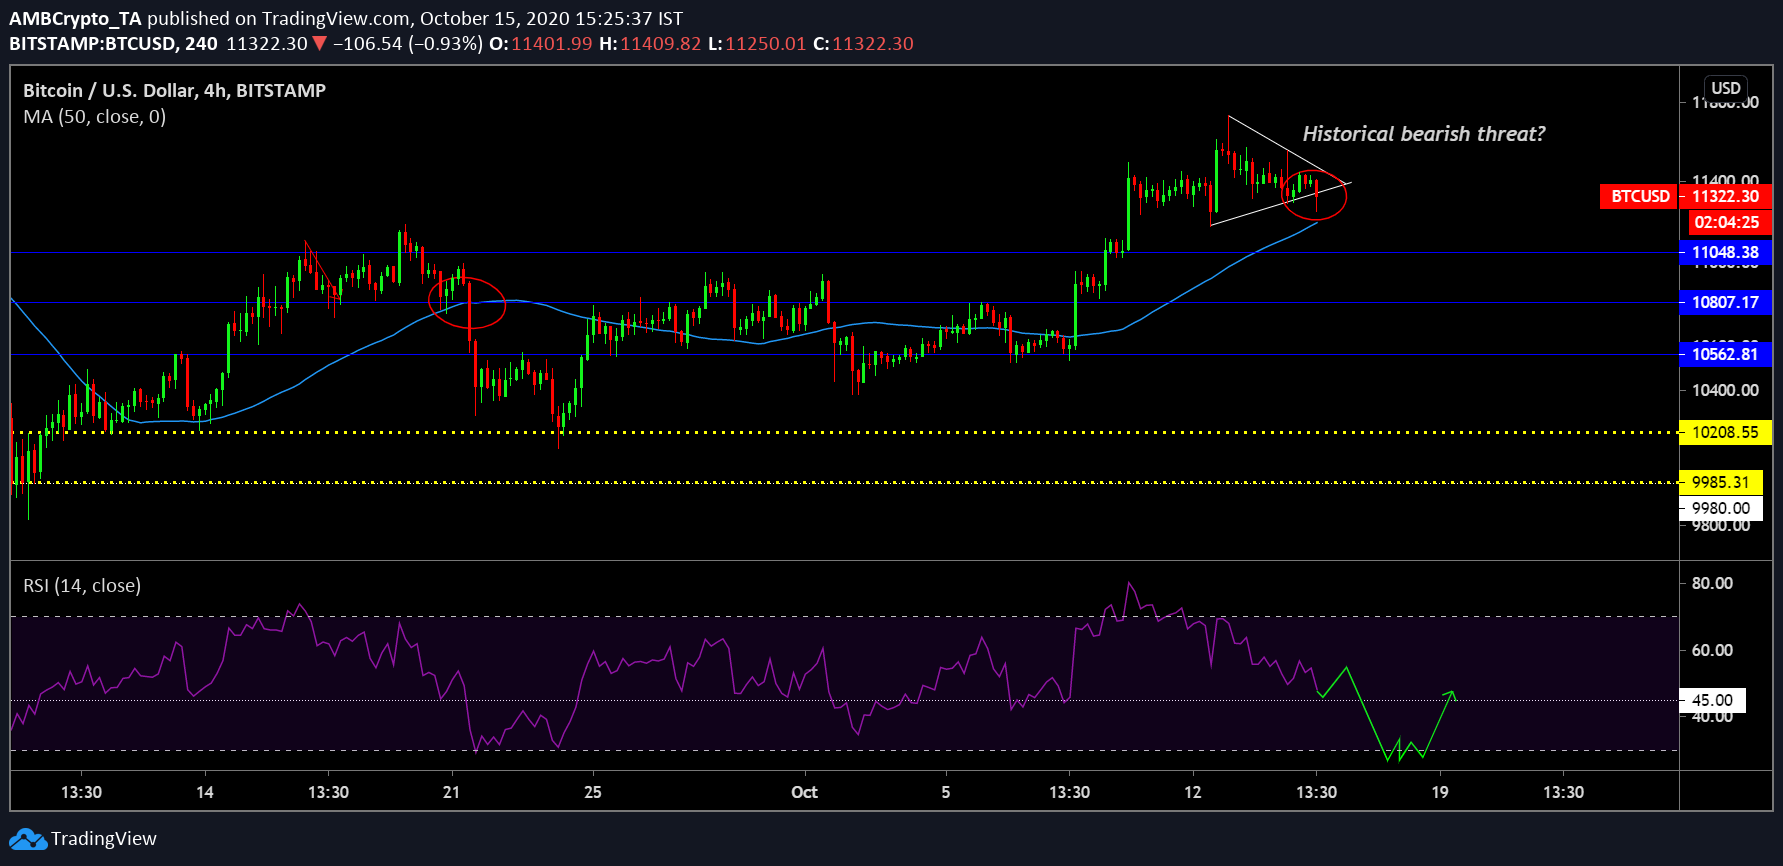
Source: BTC/USD on Trading View
The 4-hour chart for Bitcoin suggested that BTC, at press time, was breaking out a symmetrical triangle, but the crypto-asset continued to receive underlying support from the 50-Moving Average. However, the prevailing trend was reminiscent of a bearish breakout witnessed on 21 September. As highlighted in the attached chart, the price rallied before the bearish break and even though it seemed the price would bounce back from 50-MA, it did not.
After the bearish breakout, the cryptocurrency’s price tested its 2nd support and with respect to the present price range, the 2nd support level remained at $10,800, at press time.
Further, the Relative Strength Index or RSI highlighted a transitionary range as a decline below 50 might lead to selling pressure taking over control. While a re-bounce from the 50-MA was still possible, the chances of the trend repeating cannot be ignored.
Bitcoin 1-hour chart
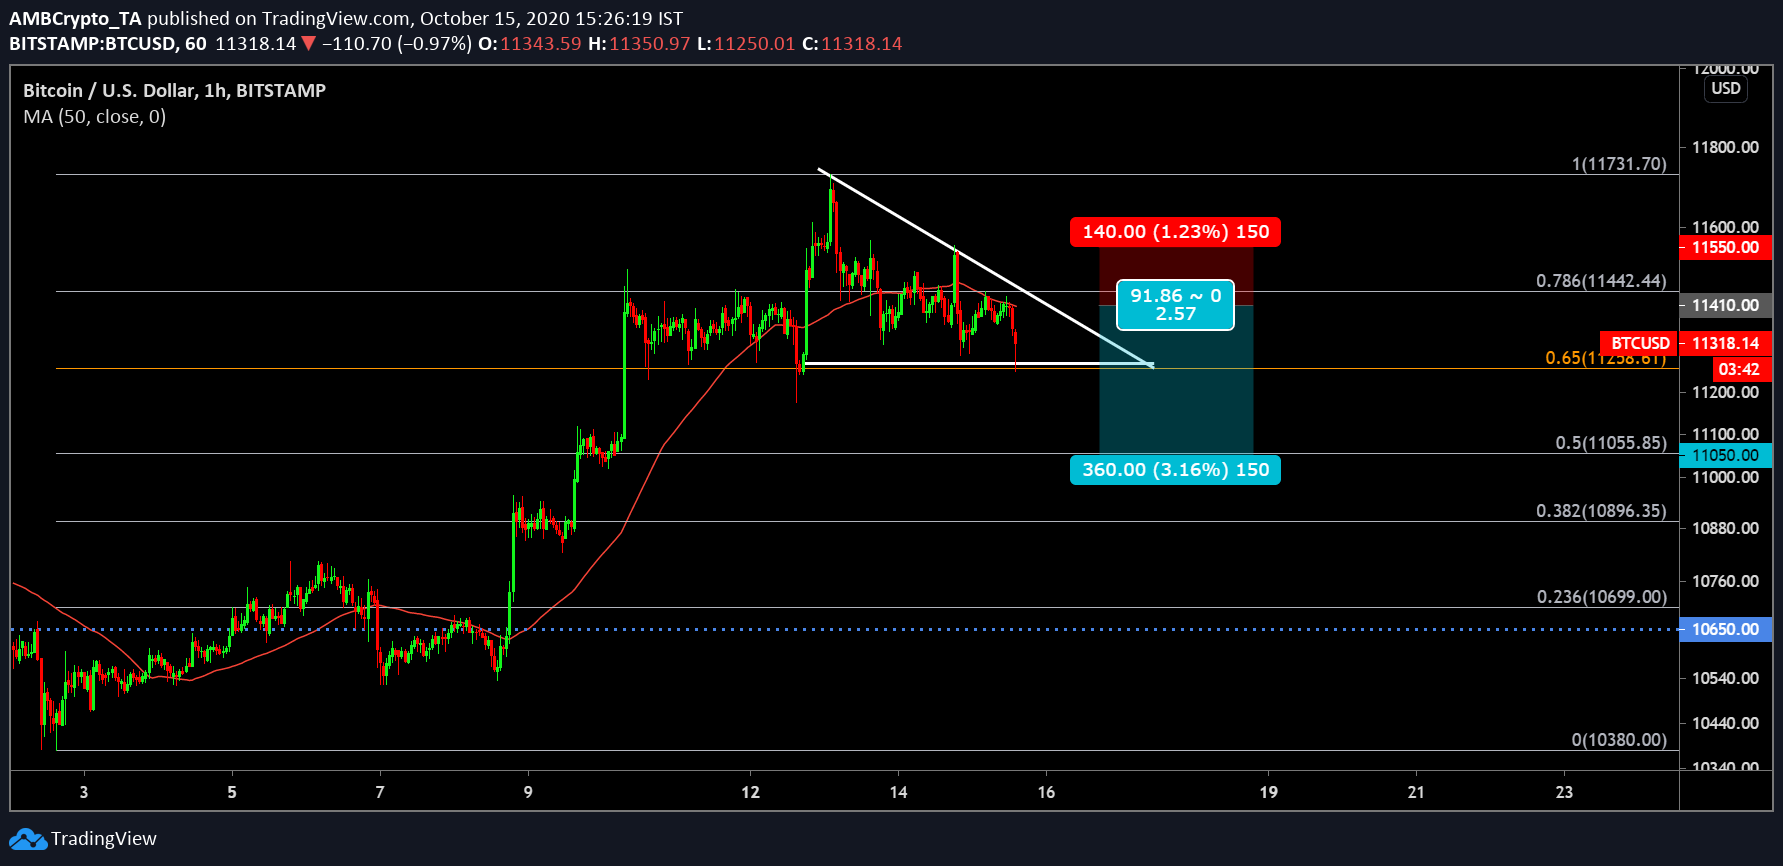
Source: BTC/USD on Trading View
In light of accounting for a bearish period, the 1-hour chart for Bitcoin pictured the formation of a descending triangle. Now, a breakout from the pattern would possibly allow the crypto-asset to drop below the 0.65 Fibonacci level, and the eventual re-test might come at $11,055 as the 1st support. However, if one were to account for trend repetition, the 2nd support could be found at $10,896.
An ideal shorting position that can be taken advantage of in this trend is setting up an entry position at $11,410 with a stop loss at $11,550. The Risk/Reward ratio of 2.57x is attained by keeping a take profit of $11,050.


