
Tezos has been on a recovery run since its price plummeted by close to 35 percent in the first week of September. While its price performance from a few months back seems like a far cry now, during the course of the past week, the coin managed to rake in the gains. However, is the coast clear for Tezos or will it have to endure yet another price correction?
At press time, Tezos was being traded at $2.29 with a market cap of $1.7 billion and a 24-hour trading volume of $169 million. Over the past week, the cryptocurrency managed to register an impressive hike of 13 percent. However, selling pressure seemed to have returned to the market at the time of writing, with XTZ noting a minor correction over the past 24-hours.
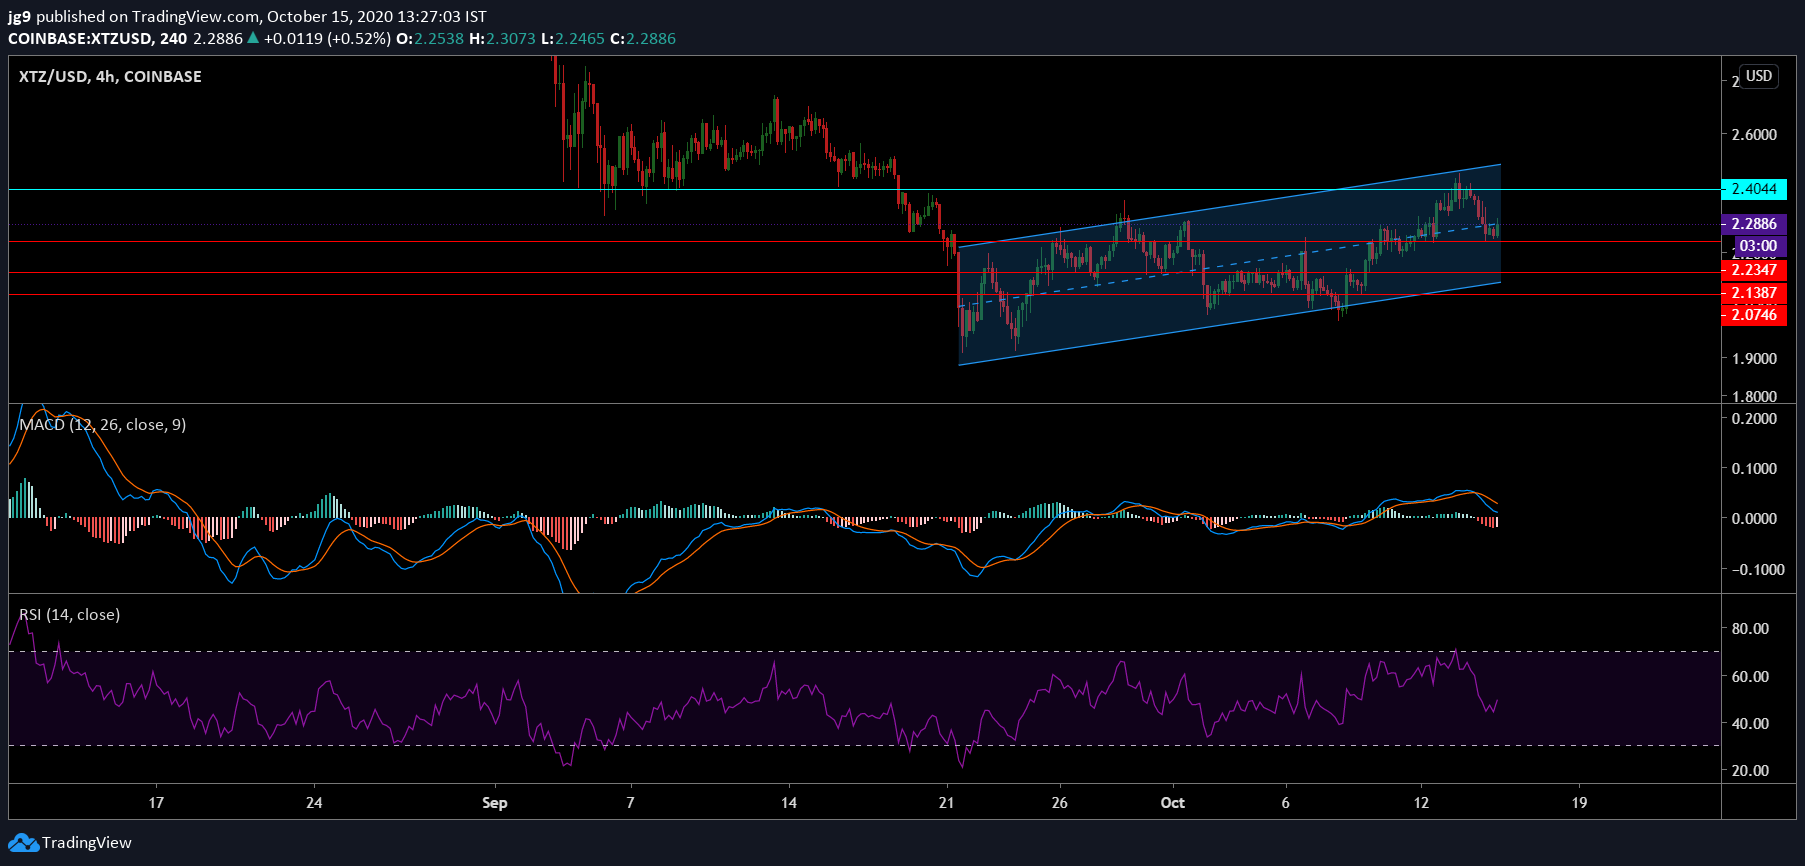
Tezos 4-hour chart

Source: XTZ/USD, TradingView
According to Tezos’s 4-hour chart, the price movement of the coin has been within an ascending channel formation for close to a month now. While a breakout downwards is the norm for such a formation, there is a high possibility that the coin will continue to remain within the formation over the coming week. This is likely to result in a minor correction and it may head towards the second support at $2.13.
At press time, the cryptocurrency’s price was testing the support at $2.2, with there being a strong resistance level for Tezos around the $2.4-mark. Over the past month, the price action of Tezos has bounced between the $2-$2.4 price level and at the moment, this consolidation is likely to continue. In the coming weeks, if the bearish momentum is to sustain itself, then the drop to the $2.13-support level will result in a 5 percent loss for the cryptocurrency’s trading price.
Source: XTZ/USD, TradingView
Further, the technical indicators for Tezos painted a bearish picture. The MACD indicator underwent a bearish crossover, with the Signal line going past the MACD line. The RSI, after having spent a considerable amount of time around the overbought zone, moved to the neutral zone and a dip towards the 40-level cannot be discounted.
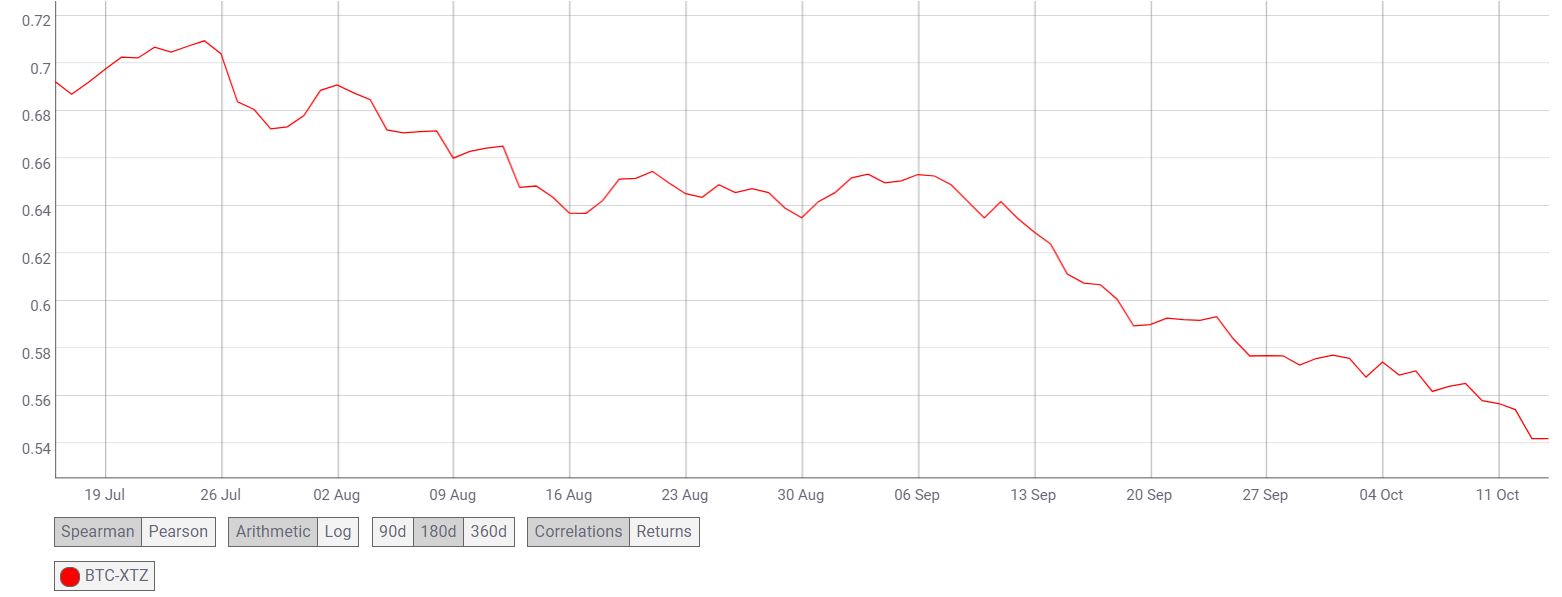
Source: CoinMetrics
A high correlation between the altcoin market and Bitcoin is the norm, however, in the case of Tezos, the coin has exhibited the tendency to initiate price trends, independent of Bitcoin. According to data provided by CoinMetrics, Tezos’ correlation with BTC has fallen over the course of the past 3 months from 0.69 to 0.54.
Conclusion
Tezos’s price has been confined to an ascending channel formation after having recorded substantial losses towards the start of September. However, a breakout is not very probable at this point as the coin is likely to endure yet another correction and in the coming week, Tezos’s price may head towards its support at $2.13.
However, if the bulls were to take over, an uptrend to the $2.4 may occur. This seemed unlikely, however, taking into account the market sentiment and the technical indicators.