
Disclaimer: The findings of the following article analyze the present volatility in the market after Bitcoin’s recent breach of $11,500
After perfectly moving in line with the rest of the crypto-market, Bitcoin, the world’s largest cryptocurrency, finally registered a rally of its own after BTC surged over the crucial $11,500-mark. While many expected BTC to breach the $12,000-mark again, the cryptocurrency seemed to be having cautiously on its way north, at the time of writing.
Bitcoin 1-hour chart
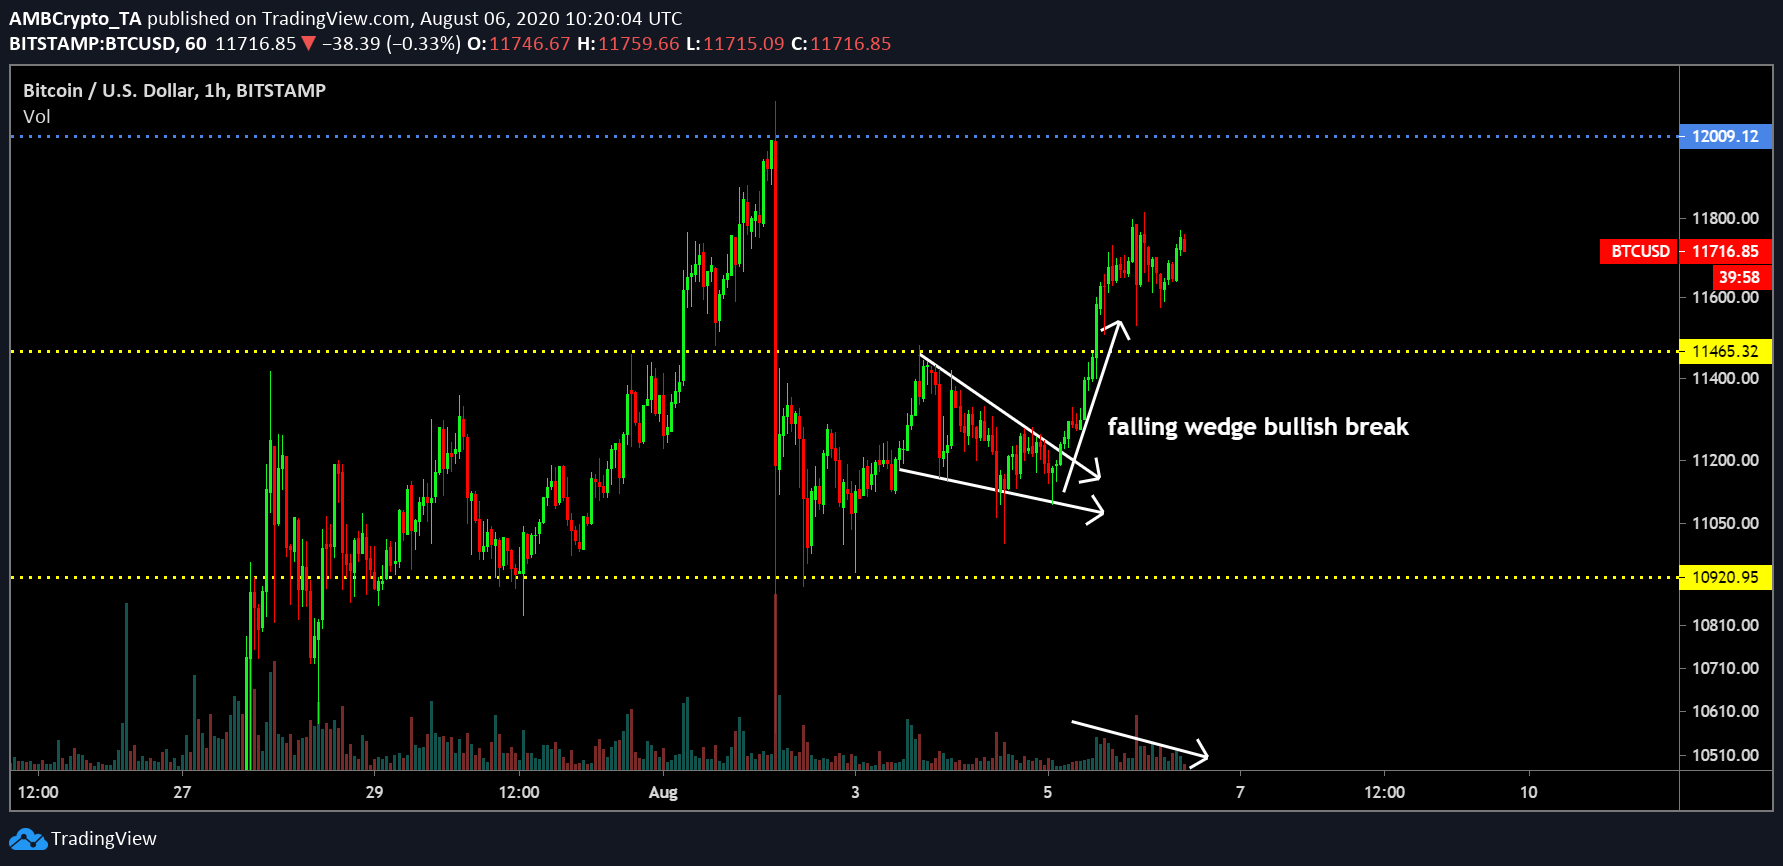
Source: BTC/USD on Trading View
The breakout above $11,500 looked pretty textbook for Bitcoin, at press time. After registering steady price movements in between the trendlines of a falling wedge, the necessary move higher up the charts was facilitated by Bitcoin. The breakout took place just under $11,200, but the rally carried the crypto-asset above its resistance at $11,500.
Now, many had expected BTC’s price to re-test $12,000 during its next rally. However, that wasn’t the case. For the same, there are a couple of matters that need to be noted first.
Bitcoin 4-hour chart
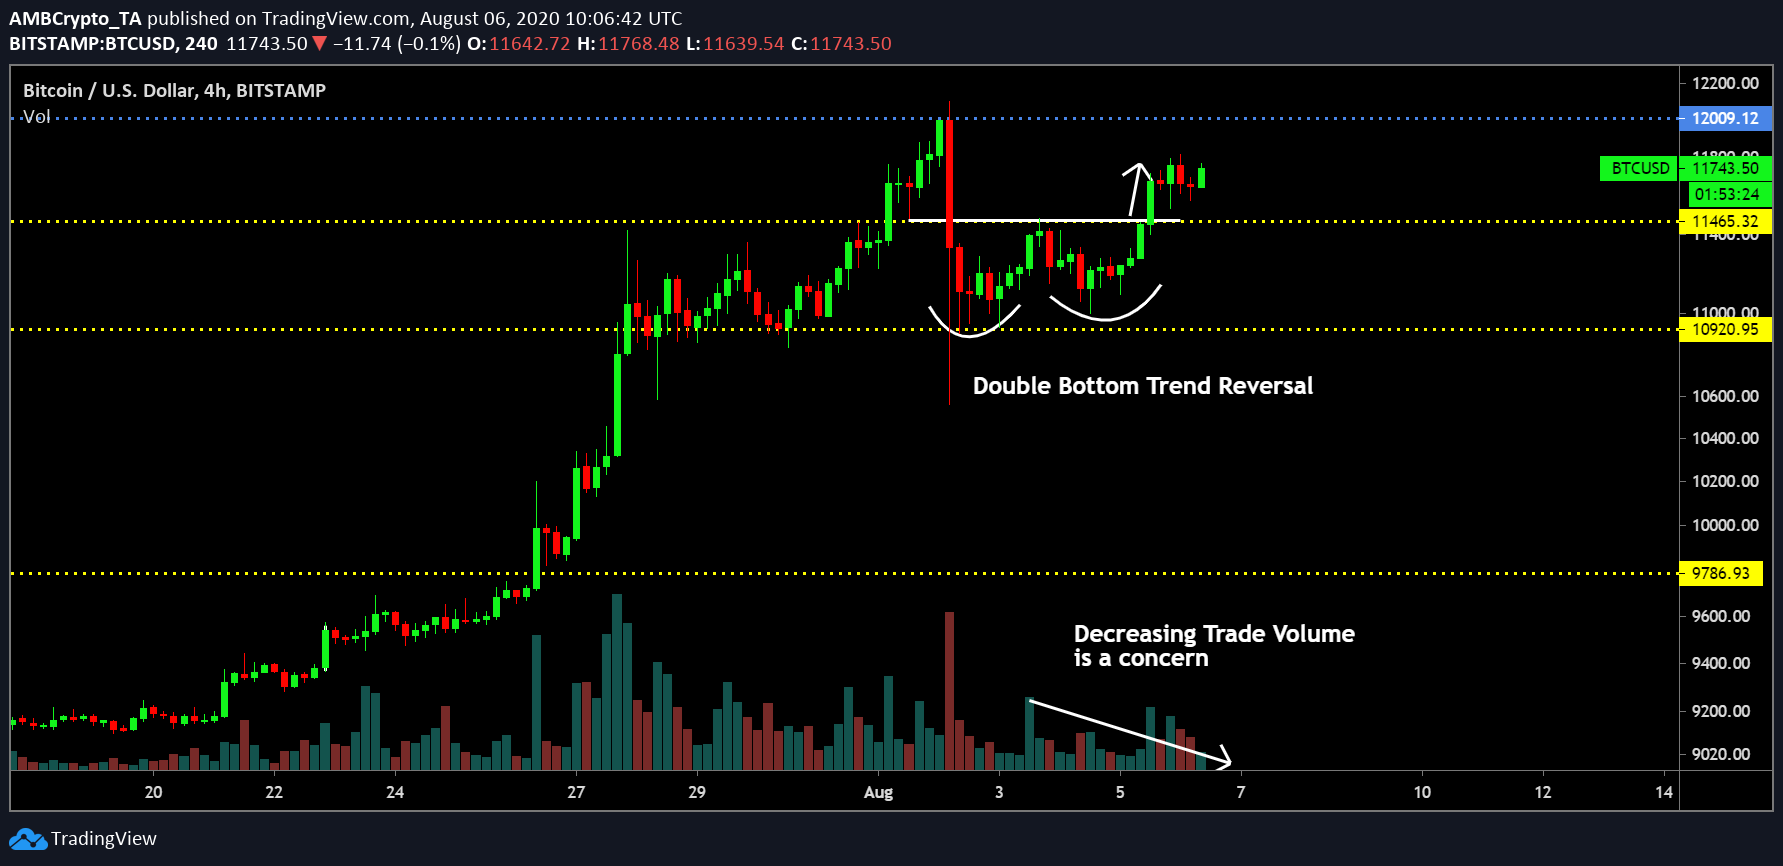
Source: BTC/USD on TradingView
After analyzing Bitcoin’s 4-hour chart, it is clear that the resistance at $11,465 should have been the key subject of discussion before the breakout, rather than BTC’s chances to test $12,000 again. Between the range of $10,900 and $11,465, Bitcoin saw a double bottom pattern, exactly what Bitcoin needed to strongly sustain a position above $11,500. This move possibly solidifies Bitcoin’s base price between $11,465 and $12,000, from which it can attain its next re-test at $12,000. It should be noted, however, that there is an asterisk attached to the latest rally.
Bitcoin’s initial rally during the end of July was backed by a huge trading volume. However, from the chart, it is clear as day that trading volume was definitely not its strongest metric during its breach of $11,500.
Such divergence draws question marks regarding the strength of the rally. Hence, it will not be surprising to see if Bitcoin drops below $11,500 once again.
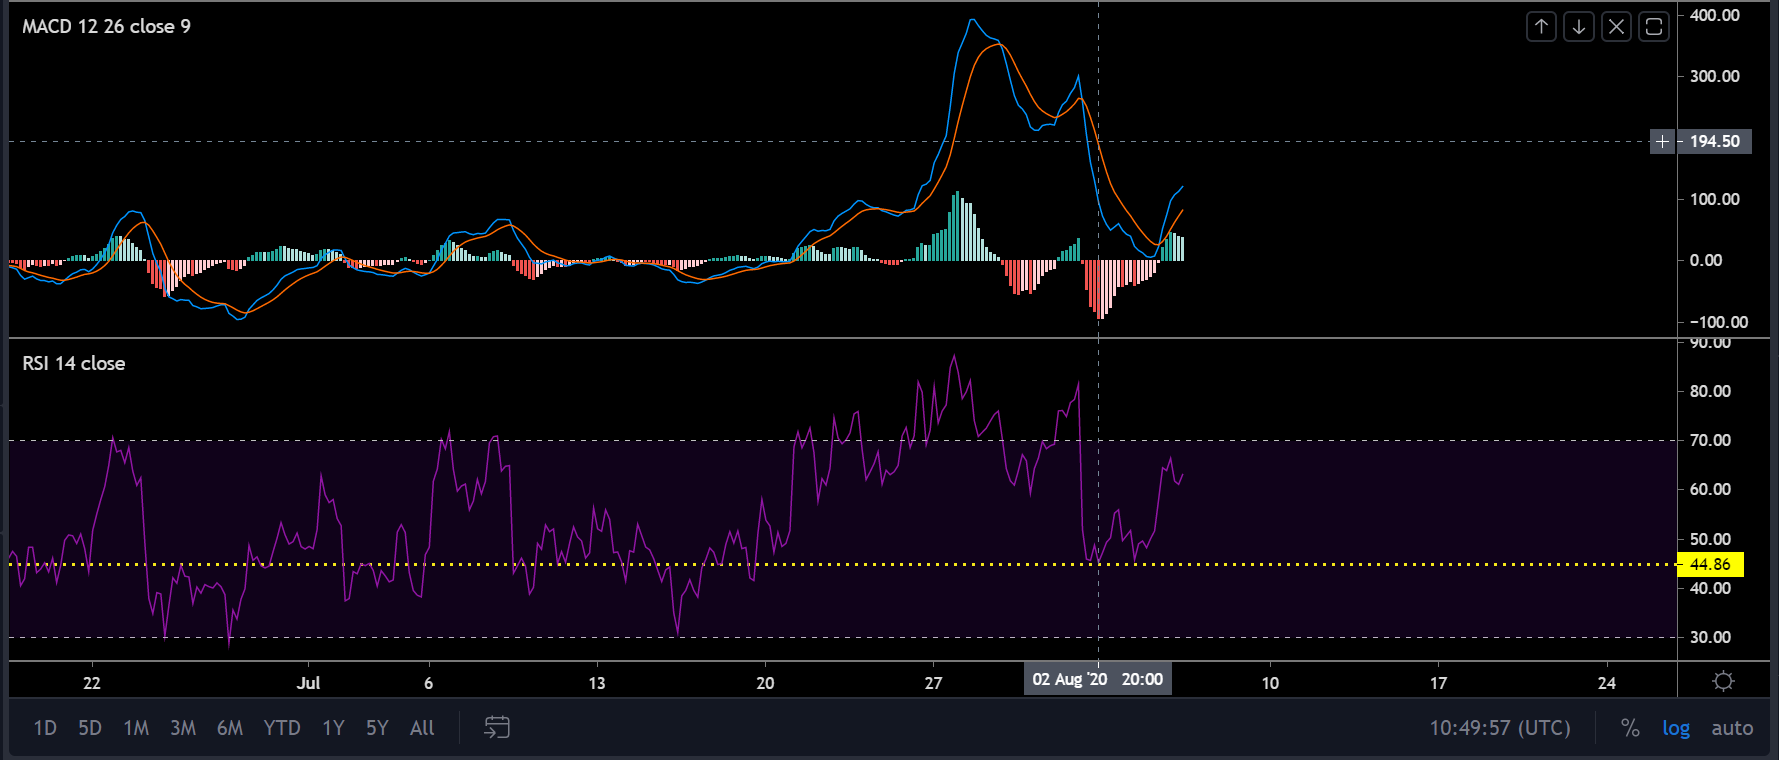
Source: BTC/USD on TradingView
Market indicators pointed to a positive period for Bitcoin as the MACD pictured a bullish trend.
Further, the Relative Strength Index or RSI also suggested that buyers were keeping their hands on the wheel for the moment, with sellers finding it difficult to take control.
Conclusion
Logically, the move above $11,500 is a positive sign for BTC, but its feeble trading volume is a concern. Over the next 24-48 hours, any new change will further clarify Bitcoin’s future trend over the next week.


