Bitcoin

Bitcoin may turn things around in March as drop below $8255 seems unlikely
Posted:
| Last updated: February 13th, 2024

After dropping under $8800 on 27th February, Bitcoin has consolidated above $8400 over the past 4 days with its valuation priced at $8629 at press time. The support levels at $8400 were tested but BTC managed to stay above for the time being. At press time, Bitcoin exhibited a minor growth of 1.04 percent over the past 24-hours but over the week, Bitcoin depreciated by over 11 percent. The market cap remained under $160 billion.
1-hour chart
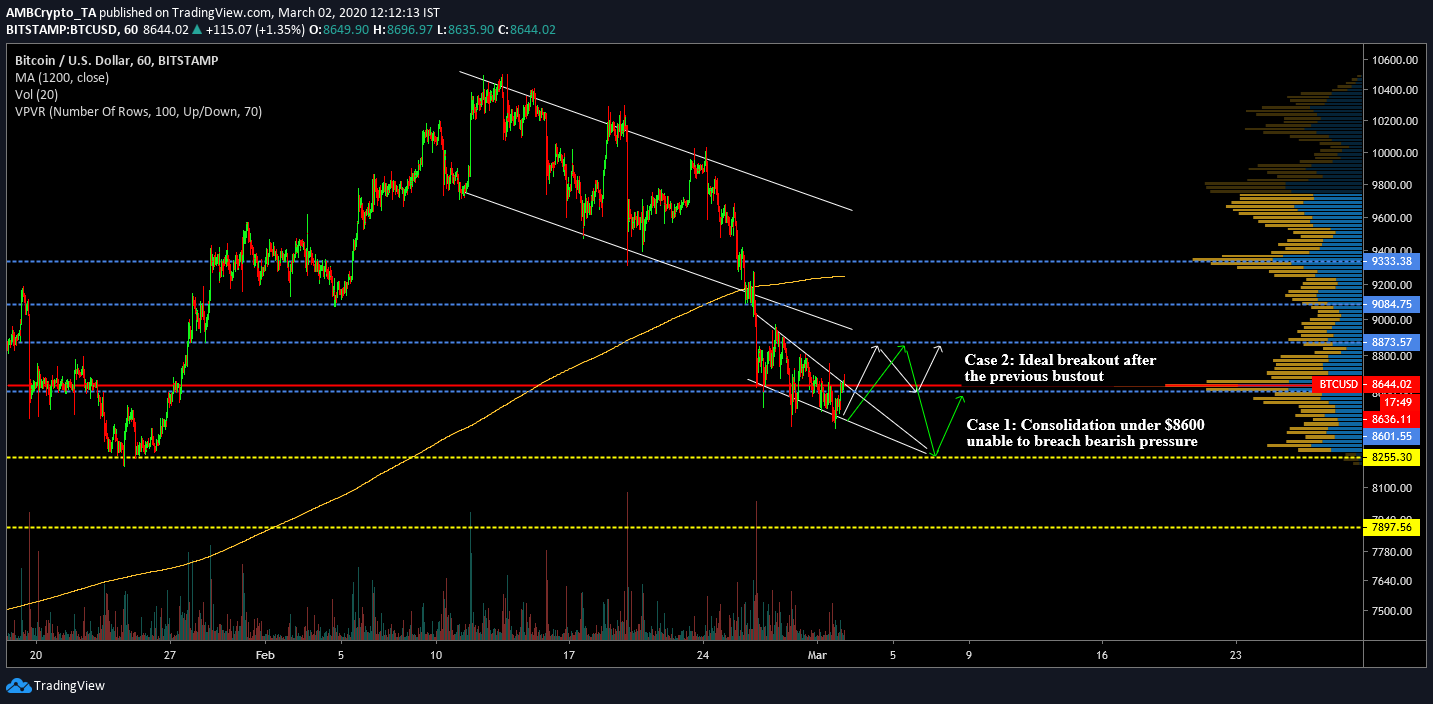
BTC/USD on Trading View
On observing the 1-hour chart, Bitcoin‘s movement over the month of February has been neutral, considering early bullish rally balanced by the current bearish predicament.
On 26th February, Bitcoin registered a bust-out from a descending channel pattern that was taking shape over the past two weeks at that time. Although the price was supposed to exhibit a bullish breakout, BTC‘s value went under $9000. The 50 Moving Average also became an active resistance after the slump.
At press time, Bitcoin pictured the formation of another bullish falling wedge pattern. The coin registered lower highs with trendlines at $9003, $8923, $8799 and $8636, which confirmed the validity of the pattern.
Analyzing the pattern and the current market sentiment, Bitcoin may have hit a temporary bottom.
A bullish rise from the current pattern may follow one of the following paths over the next week.
Case 1: A breakout will allow BTC to rise to resistance at $8873 but a correction period will see the token consolidate between $8800 and $8600 for a while before eventually breaching resistance at $8873.
Case 2: After testing resistance at $8873, Bitcoin’s price may collapse again giving in to the current bearish pressure and fall below current support at $8600. A bounce back from $8255 should surface and Bitcoin may consolidate for a few days near the resistance at $8600.
VPVR indicator and low trading volume
According to the VPVR indicator, the amount of trading volume under $8600 has been significantly less in comparison to the trading volume above $8600. Over the past few days, Bitcoin’s day-to-day trading volume has also decreased which indicated that Bitcoin’s current price is at a temporary range and it may substantially vary for the next few days.
Conclusion
Considering the bearish pressure in the short-term, Bitcoin’s valuation is open to further depreciation but a drop below $8255 seems less likely. A trend reversal is expected at the moment; after 2 weeks of correction, March may initiate the next bullish recovery.


