
Bitcoin’s surges, over lower time frames, are really good for scalps with tight stop-losses. However, doing so can also be equally risky. At the time of writing, Bitcoin was hovering around $10,550, with the world’s largest cryptocurrency eyeing the $10,600-mark and the levels above it.
Bitcoin short-term price chart
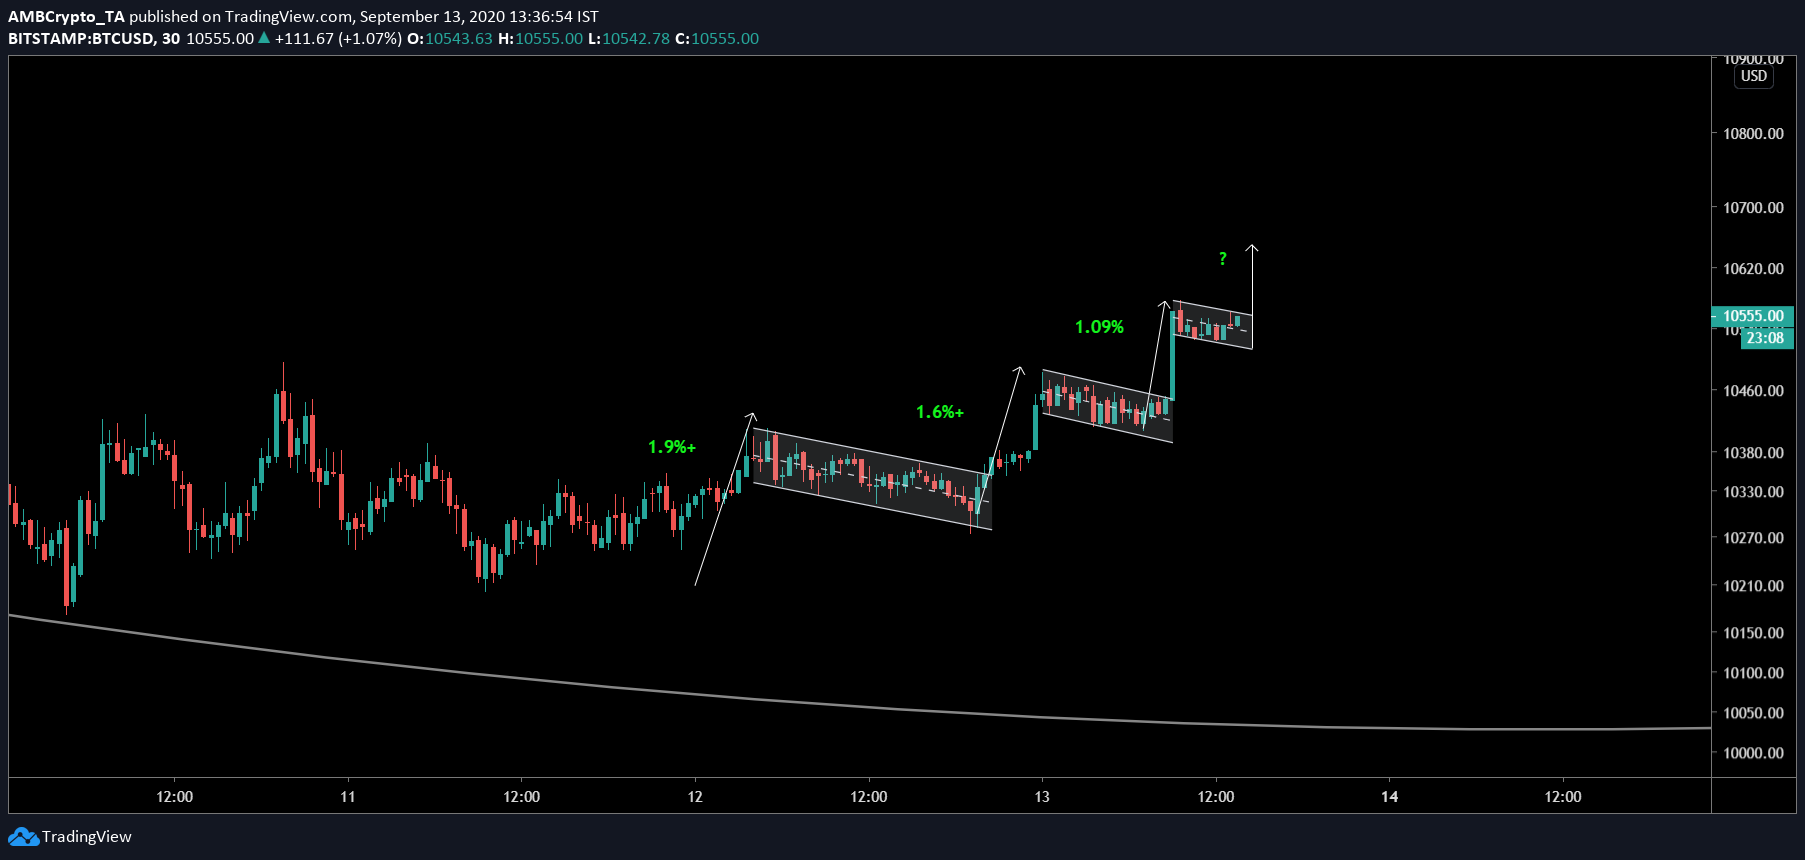
Source: BTCUSD on TradingView
Over a very short-term time frame, Bitcoin was observed to be forming bull flag patterns. In fact, another bull flag pattern was under formation, as of writing. The breakout from this is expected to push the price above $10,600 easily.
However, an observation that can be made here is that the price surges from the bull flag breakout have been on the decline. The first breakout yielded a 1.9% surge, followed by 1.6% and 1.09%. Hence, the third surge might be worth less than 1% or equal to it.
End of the day, we can expect Bitcoin to easily tap the $10,600 level and consolidate, before making another higher move on the charts.
Bitcoin medium-term price chart
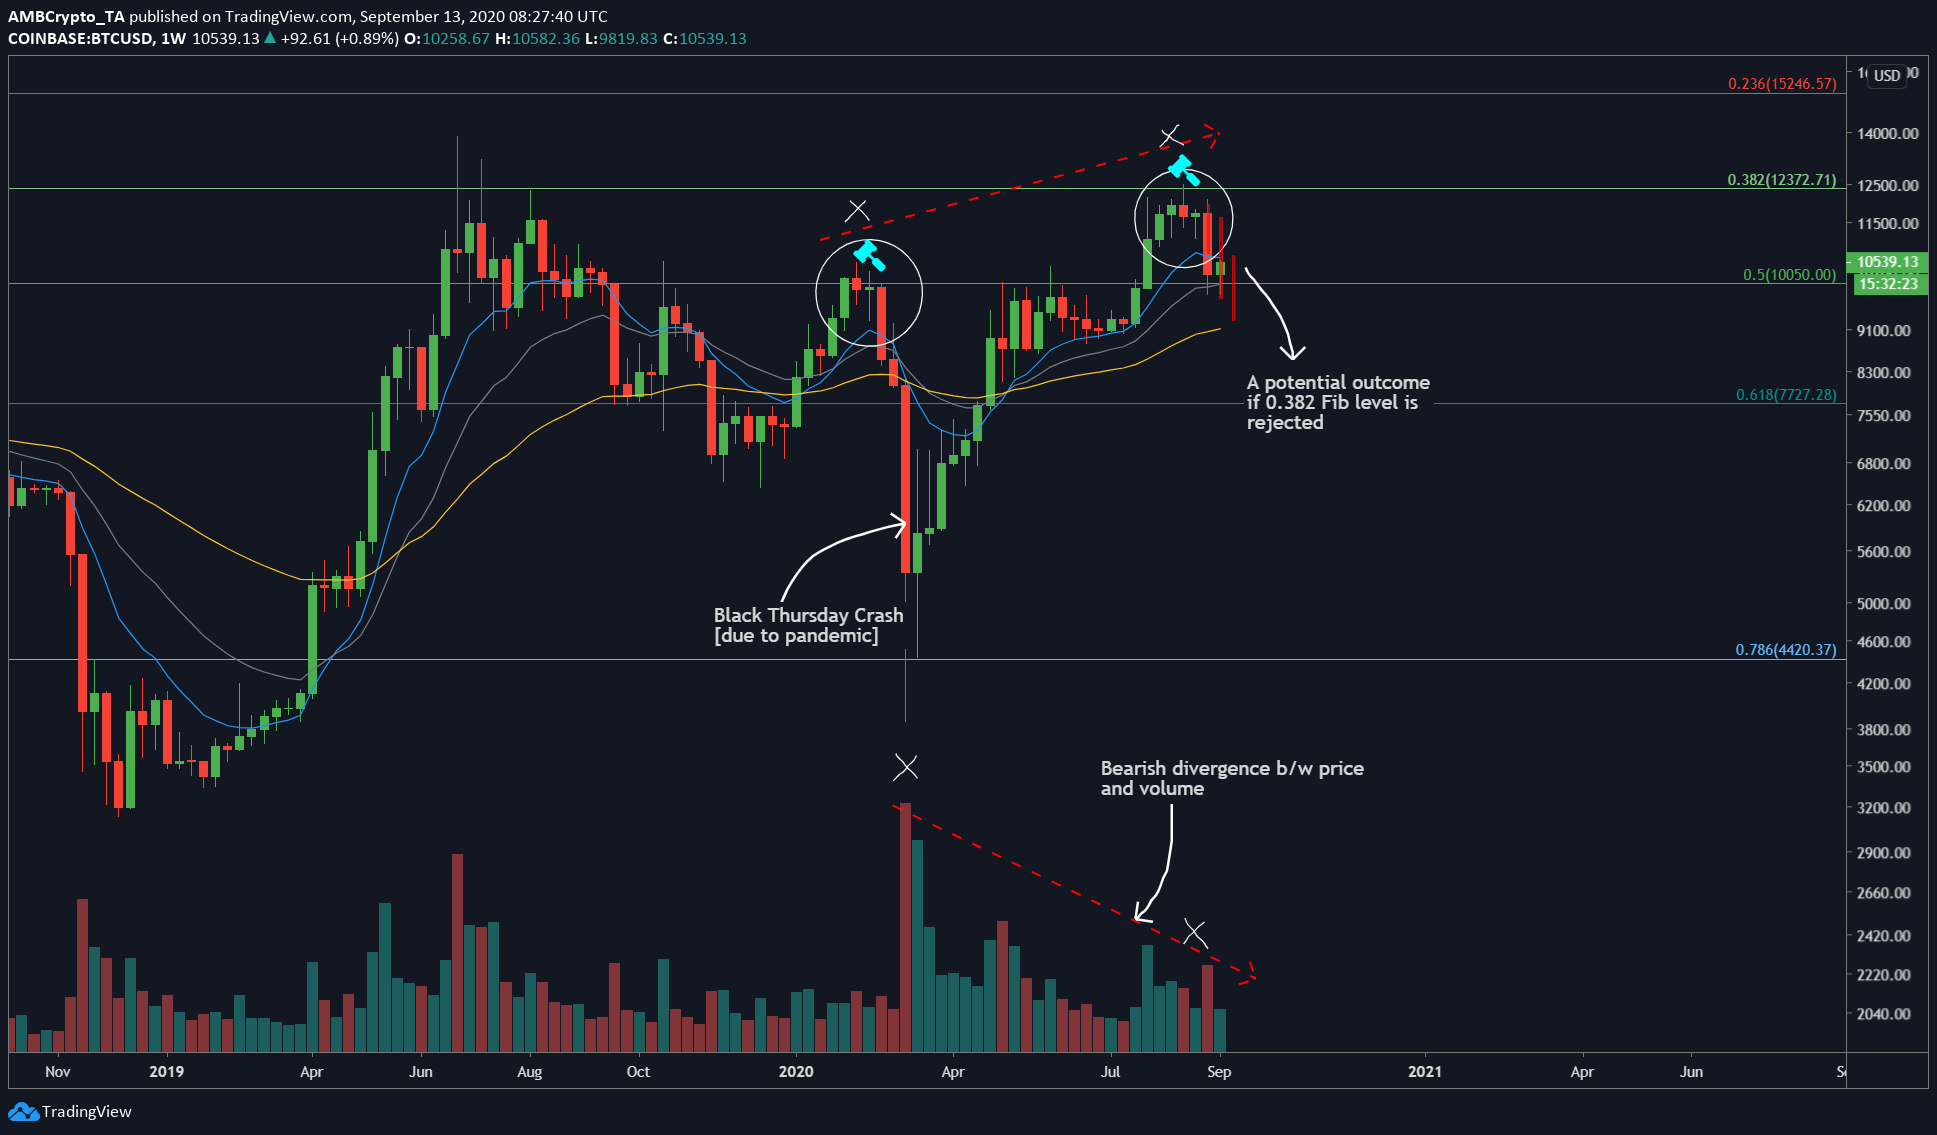
Source: BTCUSD on TradingView
In a previous article on 31 August, it had been correctly predicted that the price was due for a correction at $11,663. Surely enough, the price dropped lower on the charts until it found support at $10,050. When the weekly time frame was observed, it was found that the press time candle had turned green and in conjunction with the short-term chart, $10,600 seemed like an easy target.
As for the end goal of this pump, it should be the 10 WMA [Blue] at $10,662.
On the daily time frame, there is a confluence of resistance at $10,906. Hence, any surge above this will end up in wicks. This surge is one of the many bounces that Bitcoin will experience before it crashes to fill the CME gap. However, before the crash, there is the high possibility of Bitcoin hitting $11,000 and this will happen in the weeks to come and is a medium-to-long-term price analysis.
Surprisingly, the 200-DMA was what prevented the price from its crash into the CME gap, in addition to the demand for Bitcoin at such a low price.
To conclude, a lower time frame scalp on Bitcoin is possible. However, sticking to an alt-BTC pair would be the best choice.


