Bitcoin Cash’s price action over the past week has been promising, despite BCH having encountered a strong resistance level that stopped the coin from surging even further on the charts. While the BCH community has been split with regard to its network’s difficulty adjustment, the market’s 5th-largest cryptocurrency and fork coin has managed to stay above the prized $300-mark.
At press time, Bitcoin Cash was being traded at $302 with a market cap of $5.5 billion. Over the past 24 hours, BCH’s price had registered a dip in its price, one amounting to 5.8 percent, while also registering a 24-hour trading volume of $2.6 billion.
Bitcoin Cash 1-day chart
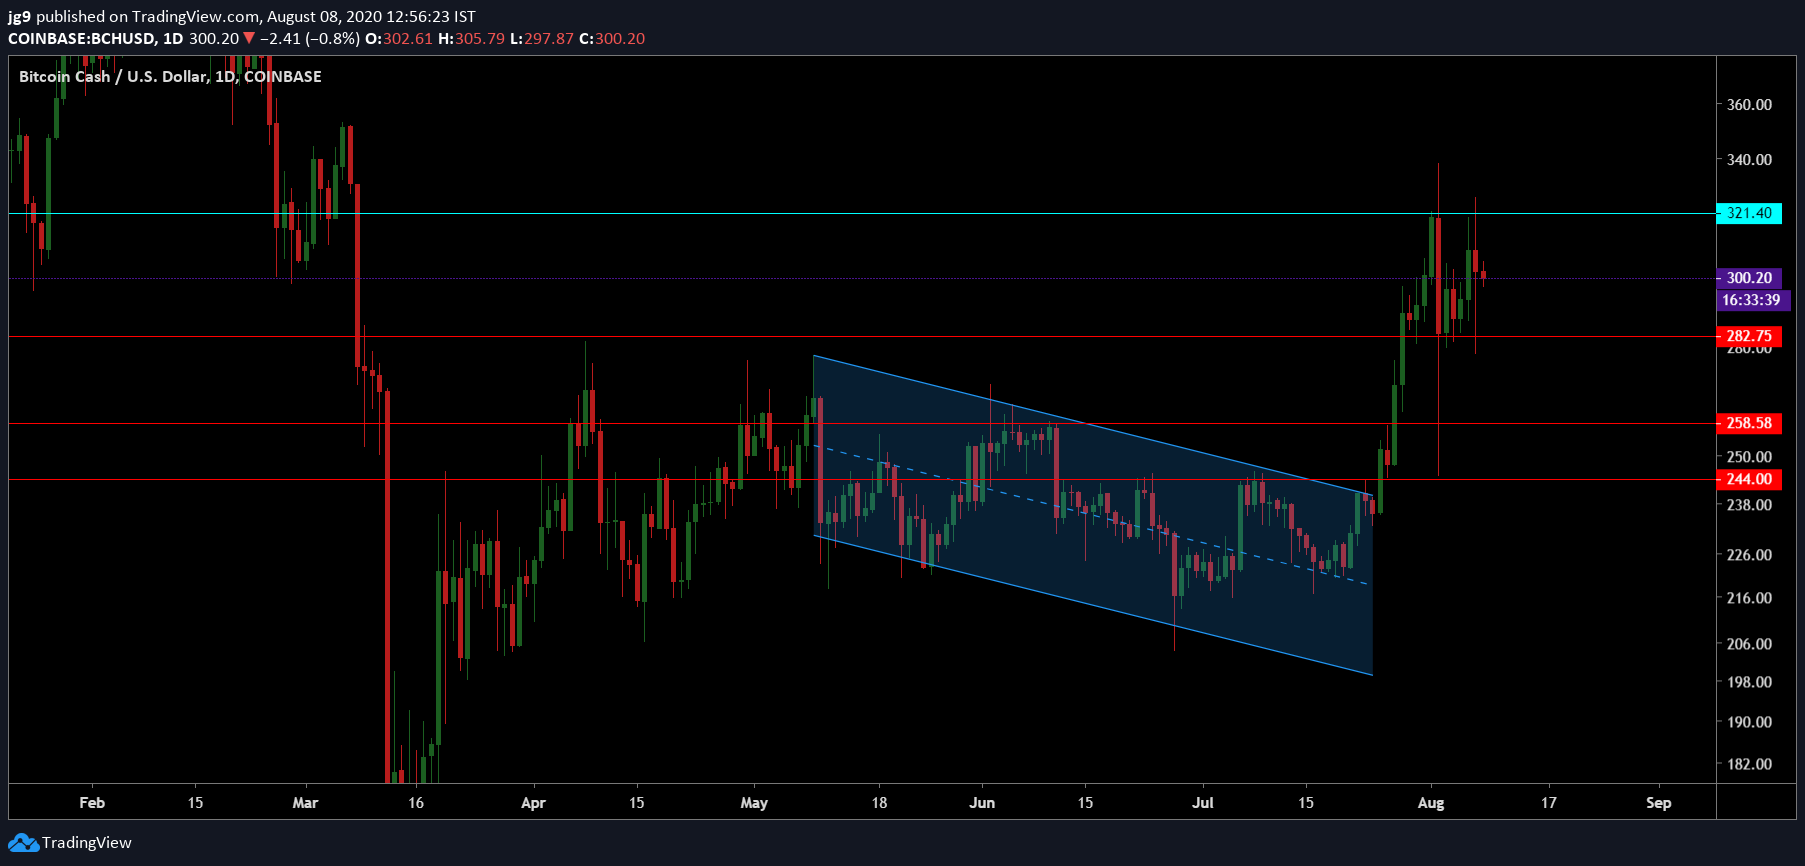
Source: BCH/USD, TradingView
According to Bitcoin Cash’s daily price charts, the price was continuing to hover above $300 after having broken out of a descending channel formation. Over the past week, BCH’s price noted a minor correction after having witnessed strong resistance at $321. The aforementioned price correction resulted in the coin’s trading value remaining within the $280 – $320 price range over the past week.
In the coming week, if the price were to see increased bearish pressure, the immediate support at $282 may be of immense help in stabilizing BCH’s price. However, there is a greater chance of BCH once again moving towards the resistance at $321, and the crypto might try to breach the same in the coming week.
At the time of writing, BCH also had two other supports at $258 and $244, if the price were to see a major trend reversal.

Source: BCH/USD, TradingView
The MACD indicator witnessed a bullish crossover earlier in August and there was a slight possibility of a reversal, at press time. The RSI indicator continued to remain closer to the overbought zone, however, the indicator was later moving towards the neutral zone.
Bitcoin Cash 4-hour chart

Source: BCH/USD, TradingView
Taking a look at the 4-hour chart, it was observed that BCH’s price had formed an ascending triangle formation, one that backed up the possibility of the price heading towards the immediate resistance within the second week of August.
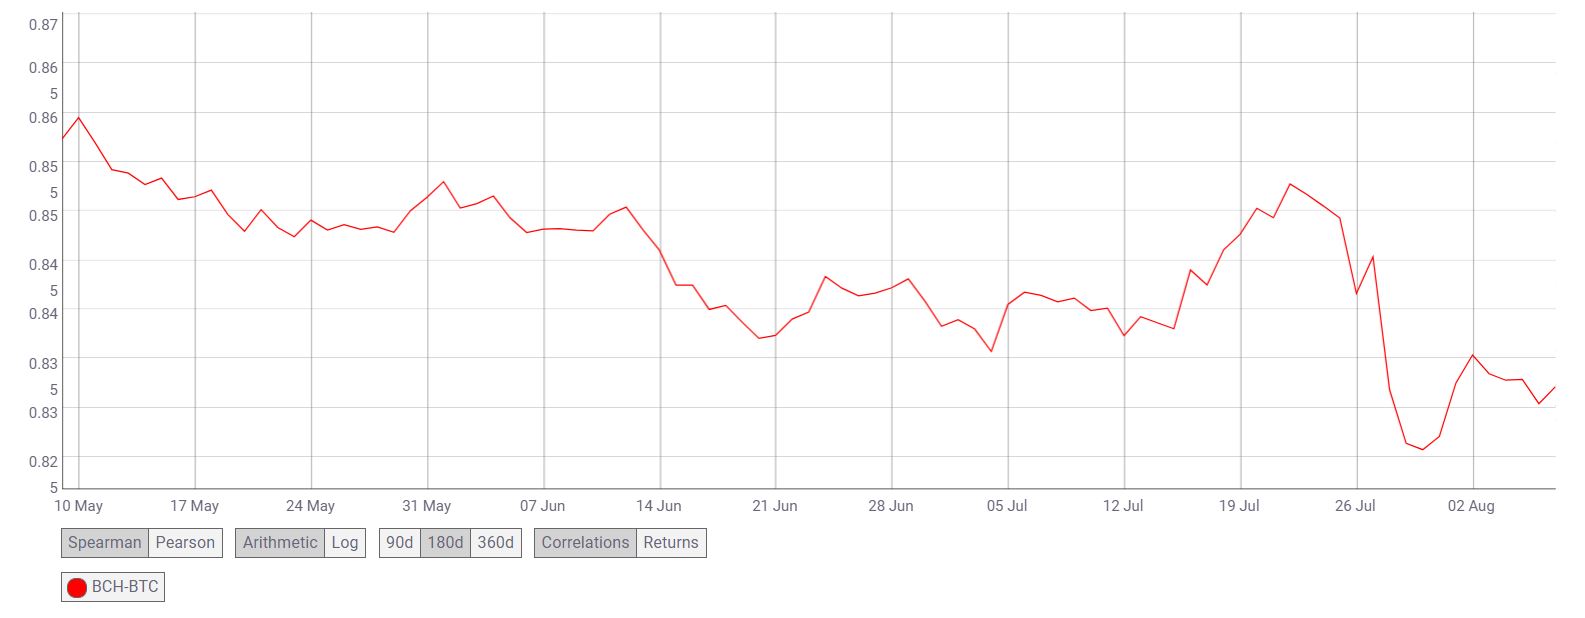
Source: CoinMetrics
In the past 3 months, the correlation with Bitcoin saw a minor drop, falling to 0.82. However, as is the case for many of the altcoins in the market, BCH’s correlation with the king coin was hinting at a rise, at press time.
Conclusion
BCH’s price has continued to stay above $300. However, taking into account the price formation and the indicators, Bitcoin Cash may take yet another swipe at the $321 resistance in the coming week.