Bitcoin Cash has moved back up to 5th in the charts after dropping down to 8th a few weeks earlier, and now the asset indicated a return of collective volatility alongside the market. While the asset tested $267 earlier this week, currently it is consolidation near $250. With the trend gunning for another breach above, we analyzed BCH’s current and future possible moves.
Bitcoin Cash 4-hour chart
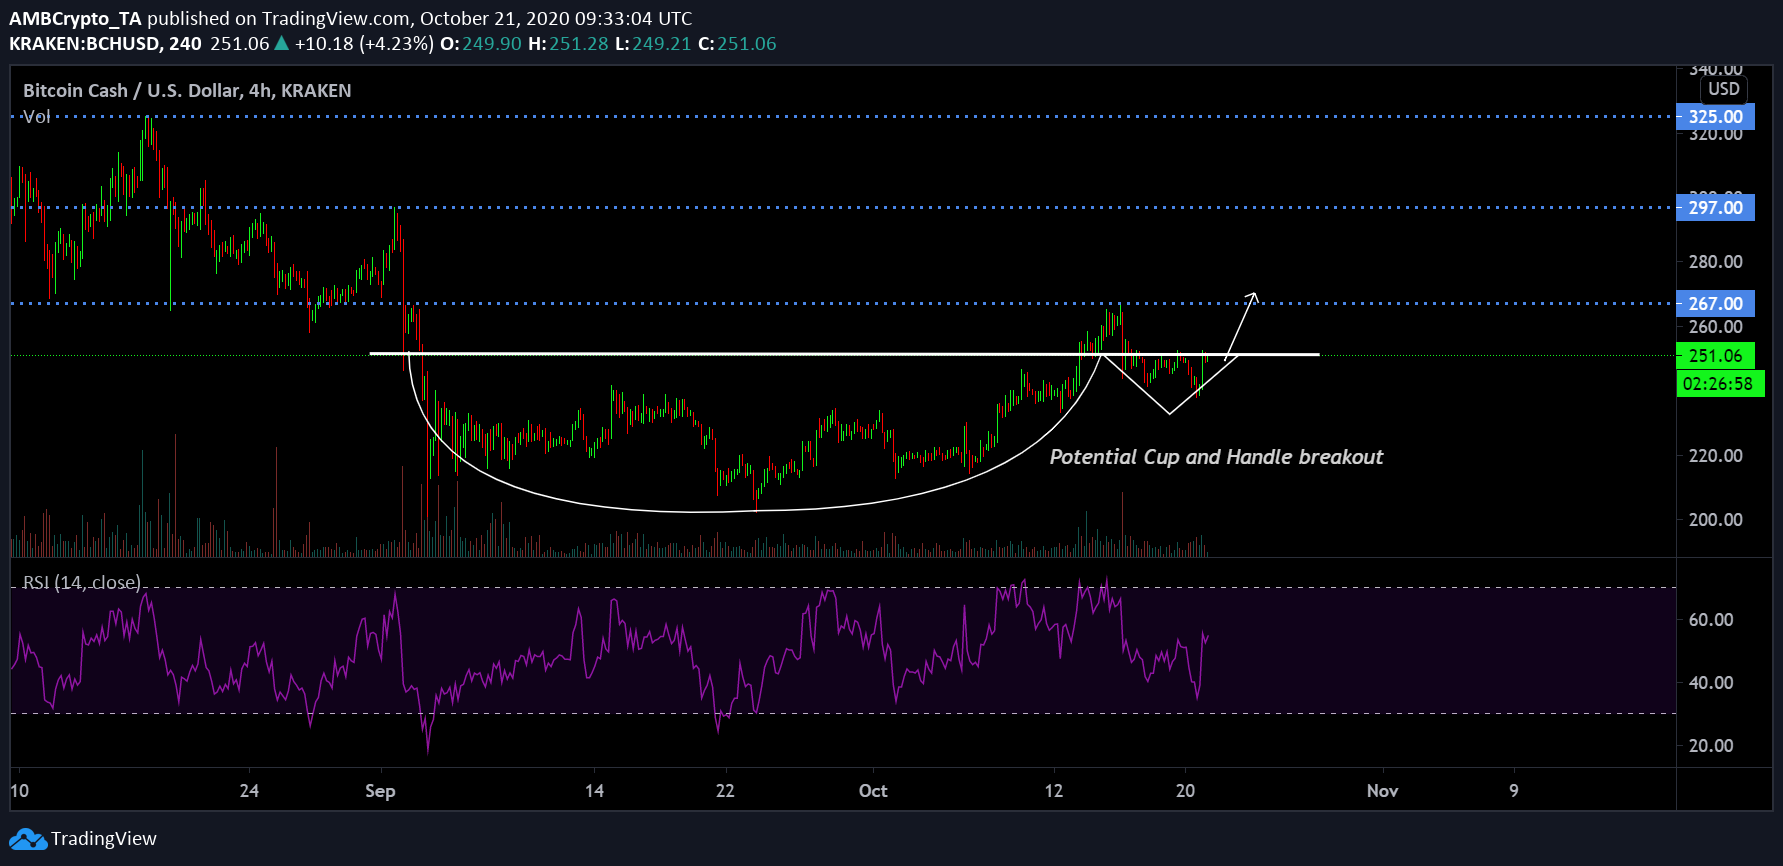
Source: BCH/USD on Trading View
While Bitcoin Cash is currently consolidating near the $250 range, the price of BCH attained a high of $267 on October 16th. While the re-test at the resistance was less than anti-climactic, the current cup and handle pattern might indicate a prevalent bullish breakout. Awaiting completion since its formation in the 1st week of September, the pattern is close to a breakout if the market structure behaves according to the analysis. While volatility and correlation played important factors as well, BCH’s current price movement is definitely in-line to attain a position above $267 or $270.
Long-term resistances were highlighted at $297 and $325. Relative Strength Index or RSI also suggested that the buying pressure is finally mounting a strong recovery. If the trend follows up on the bullish nature of the pattern, a likely retest at $300 is possible.
Bitcoin Cash 1-week chart
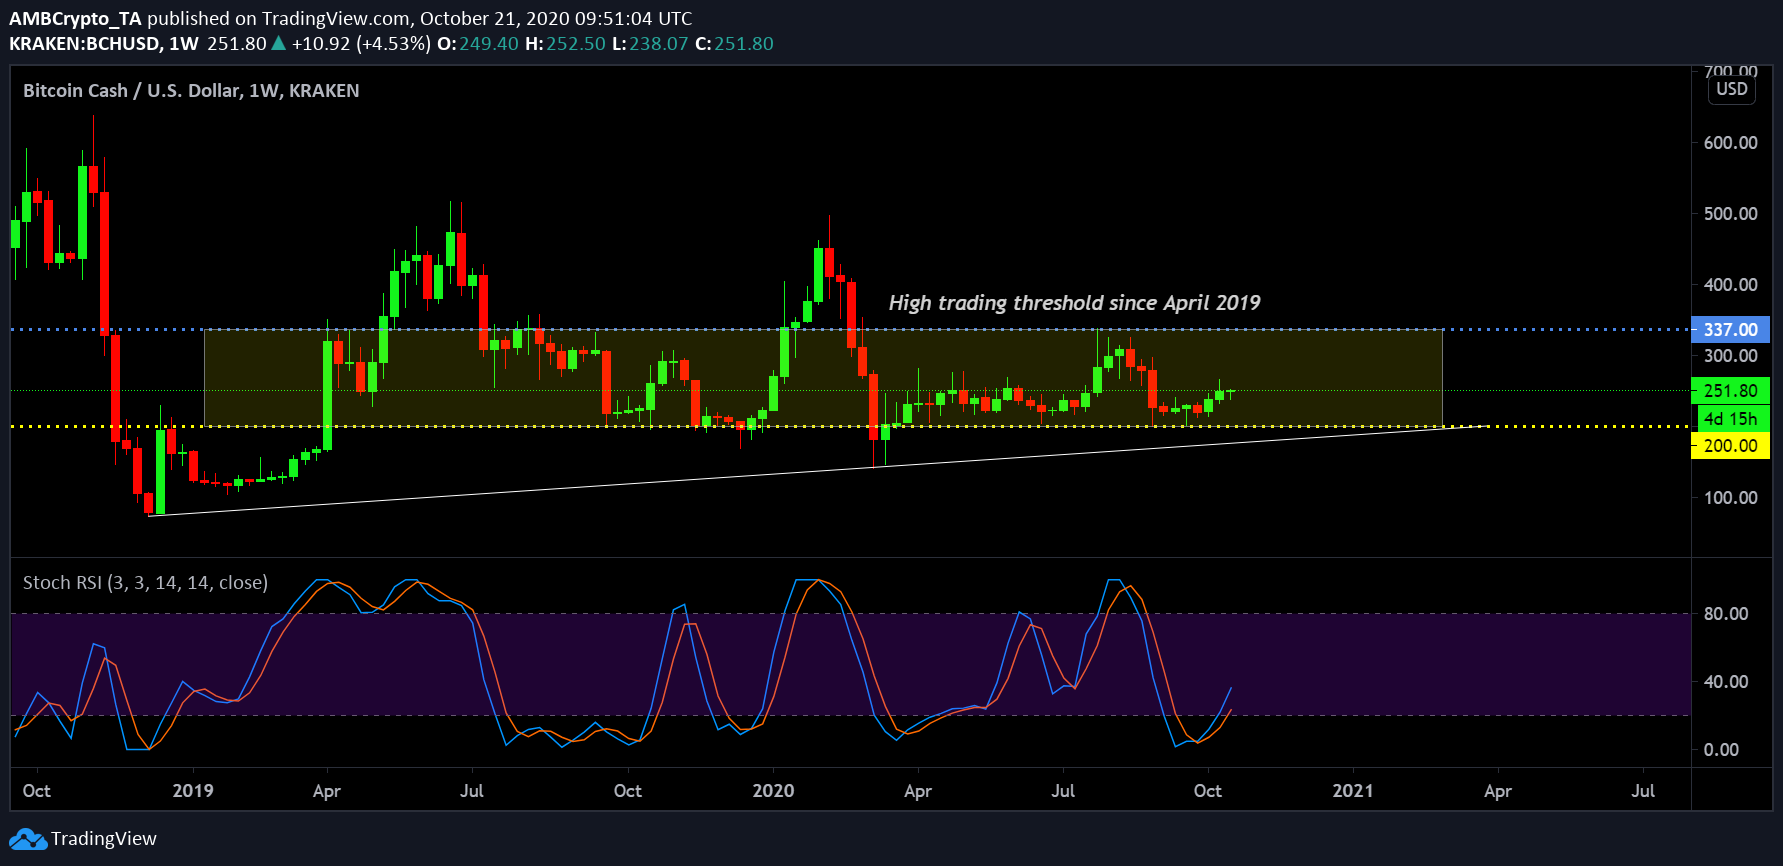
Source: BCH/USD on Trading View
Now, on the weekly chart, Bitcoin Cash might not be evidently bullish or bearish but a lot is understood about its price movement. Dating back to April 2019, Bitcoin Cash’s price range over a weekly basis has largely been constricted between $337 and $200. A brief spell in May-June 2019 and earlier this year in February, BCH managed to climb up near $500 but a similar rally did not translate during July end.
While the asset has continued to rally up since its crash below $100 in 2019, question marks continue to rise whether the range between $337-$200 can be escaped. Stochastic RSI suggested a bullish turnaround at press time, but unless the price moves above $337, the weekly chart continues to pictures a similar sideways trend.