
Disclaimer: The findings of the following article are the sole opinion of the writer and should not be taken as investment advice
Bitcoin Cash’s price faced a prolonged period of sideways movement over the past two months. However, when the cryptocurrency’s price action over a longer timeframe is looked at, one can observe that BCH has been on a gradual uptrend over the period, despite it being confined within a large ascending channel formation.
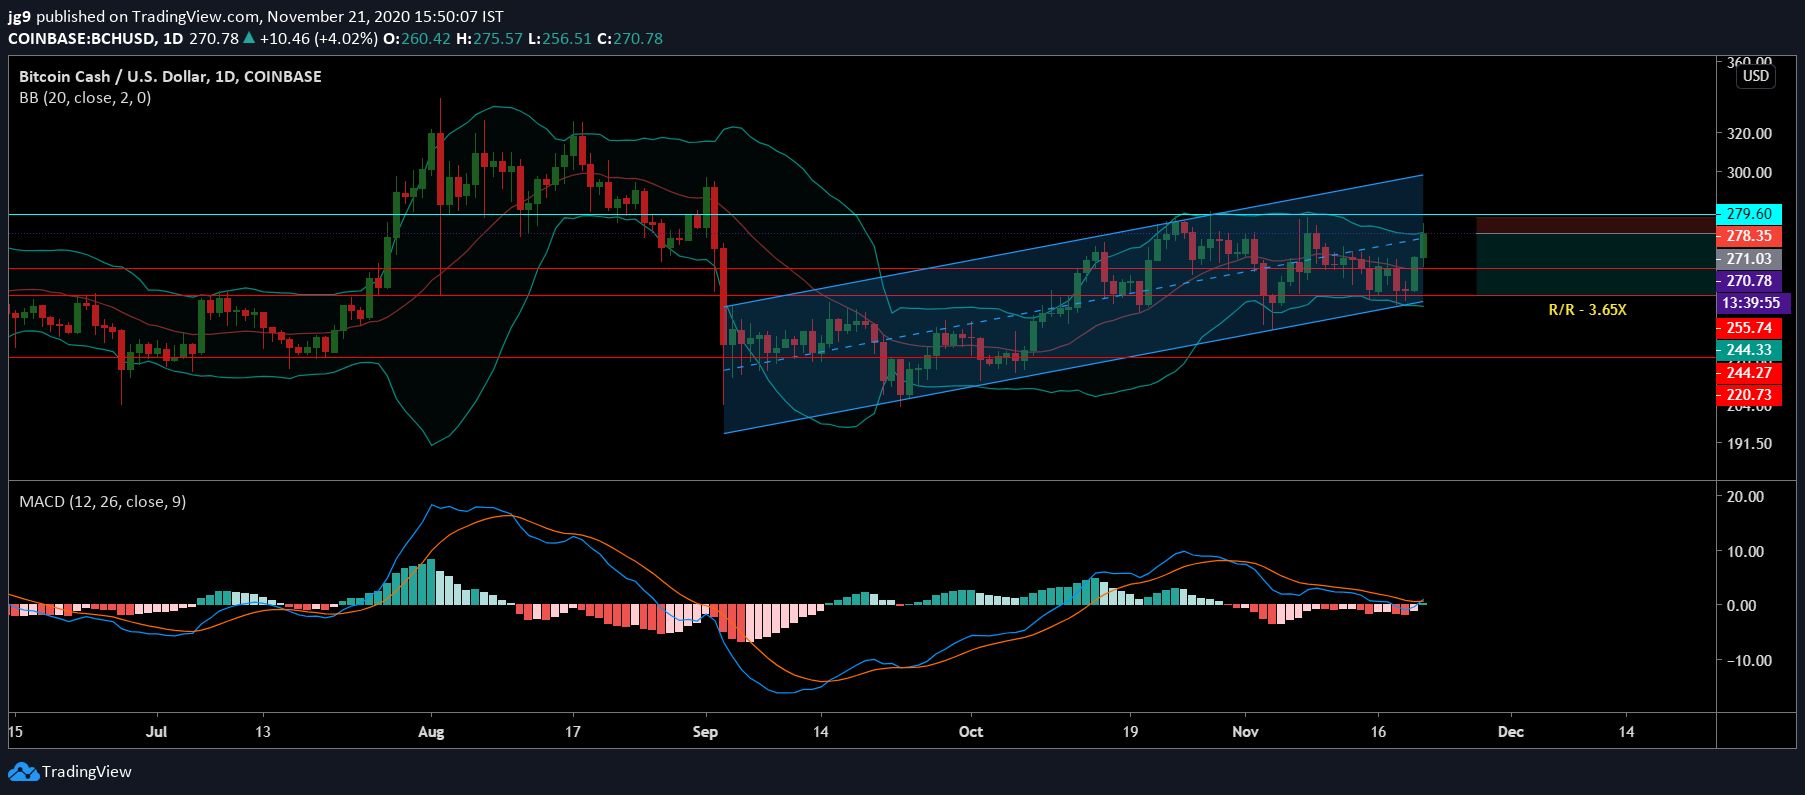
At press time, Bitcoin Cash was being traded at $270, with a market cap of $4.9 billion and a 24-hour trading volume of $3.1 billion. Over the past 24-hours, the strong bullish sentiment in the crypto-market had allowed BCH’s price to rise by over 4 percent on the charts.
Bitcoin Cash 1-day chart
Source: BCH/USD, TradingView
According to Bitcoin Cash’s daily chart, the cryptocurrency’s price has moved within the range of the support at $220 and the resistance at $279, since the start of September. Since the price is part of an ascending channel formation, if a breakout does happen in the coming week, it is likely to force a price correction for BCH. Given the fact that the price, at the time of writing, was testing the support at $255, a correction would mean that there is a strong chance that BCH’s valuation might dip to the next support level at $244.
Over the course of the week, after having faced strong resistance around the $279-level, the coin’s trading price did fall under the said level. Given the fact that the said resistance levels haven’t been breached, more drops can be expected.
Reasoning
Compared to most of the market’s altcoins, the bullish momentum for BCH isn’t very strong. In fact, at press time, the MACD indicator for the coin had undergone a reversal. Since the start of the month, the MACD remained in a bearish crossover with the Signal line continuing to hover over the MACD line.
Further, the Bollinger Bands continued to contract and indicated low volatility for the coin. Given the fact that there isn’t much bullish pressure and volatility for BCH, there is a high chance that the crypto will once again have to endure continued sideways movement which can also lead to minor corrections, as seen over the previous week.
Important levels
Resistance: $279
Support: $255, $244, $220
Entry: $271
Take Profit: $244
Stop Loss: $278
Conclusion
BCH’s price has been in an ascending channel formation for close to three months, and the coin may be on the verge of a bearish breakout. While the MACD has undergone a bullish crossover, the crypto continues to be plagued by sideways movement. This can result in a minor correction, one forcing BCH’s trading price to its second support level at $244.