
Bitcoin has been in a dilemma ever since it hit the $13,800 mark on June 26, with the price having collapsed by 30% since then. A new dilemma that has now engulfed Bitcoin is the rising wedge pattern and the direction of its breakout.
Source: TradingView
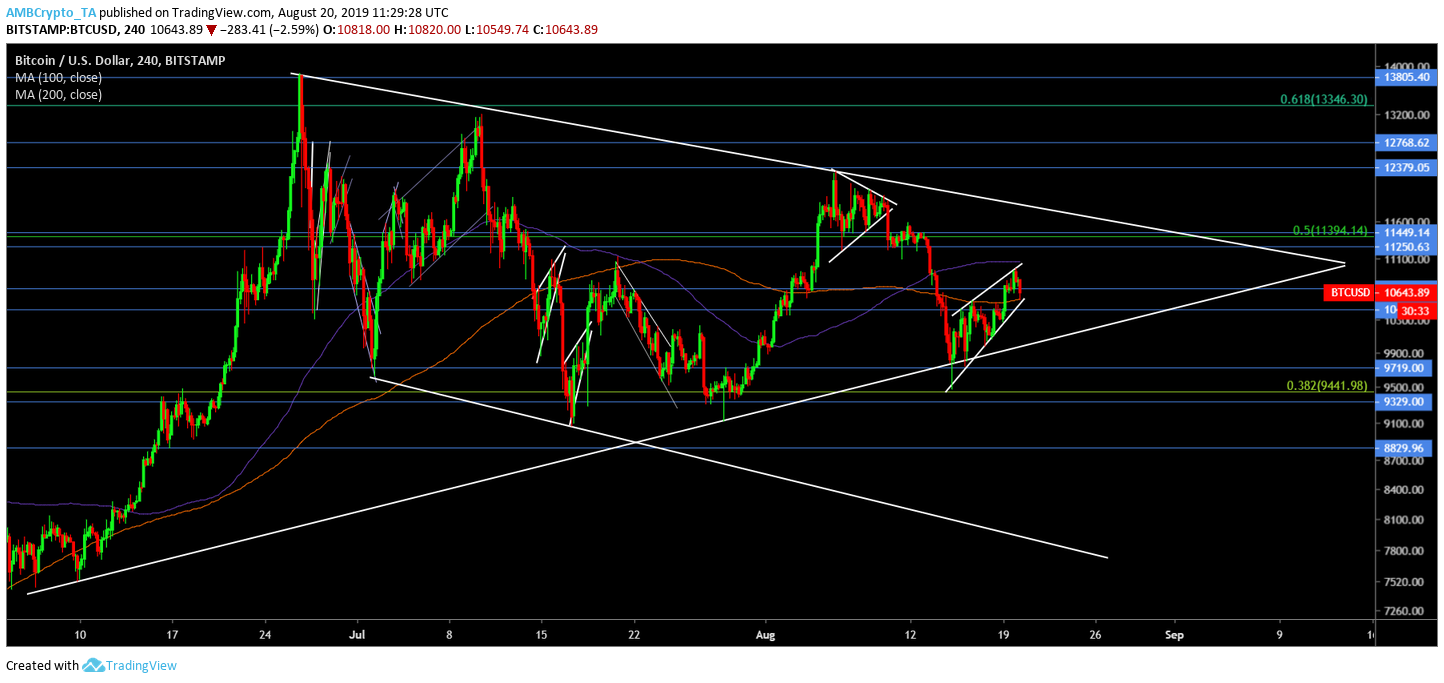
As seen in the chart above, the price of Bitcoin has been in the rising wedge for over 5 days and is conveniently reaching the end of the pattern, signifying a breakout. The rising wedge could be related to Bakkt’s recent announcement. The direction of the breakout is the deciding factor in Bitcoin’s movement over the next few days; if it breaks out to the bottom, there will be more sideways movement and re-testing of the old supports. However, if it breaks out to the upside, the price might witness a change in trend altogether.
Scenario 1
The price breaks to the downside. Supporting this breakout is the RSI, which has already begun its descent after it failed to reconquer the RSI resistance at 60. Further, the price has already breached resistance at $10,700 and has already started to invalidate this move after the Supreme Court released a notice of appeal filed by Bitfinex. Bitcoin tumbled down by more than 3% due to this.
Target: The price will test the $10,000 level; breaching it would mean a brief dip into the $9,700 levels.
Scenario 2
Source: TradingView
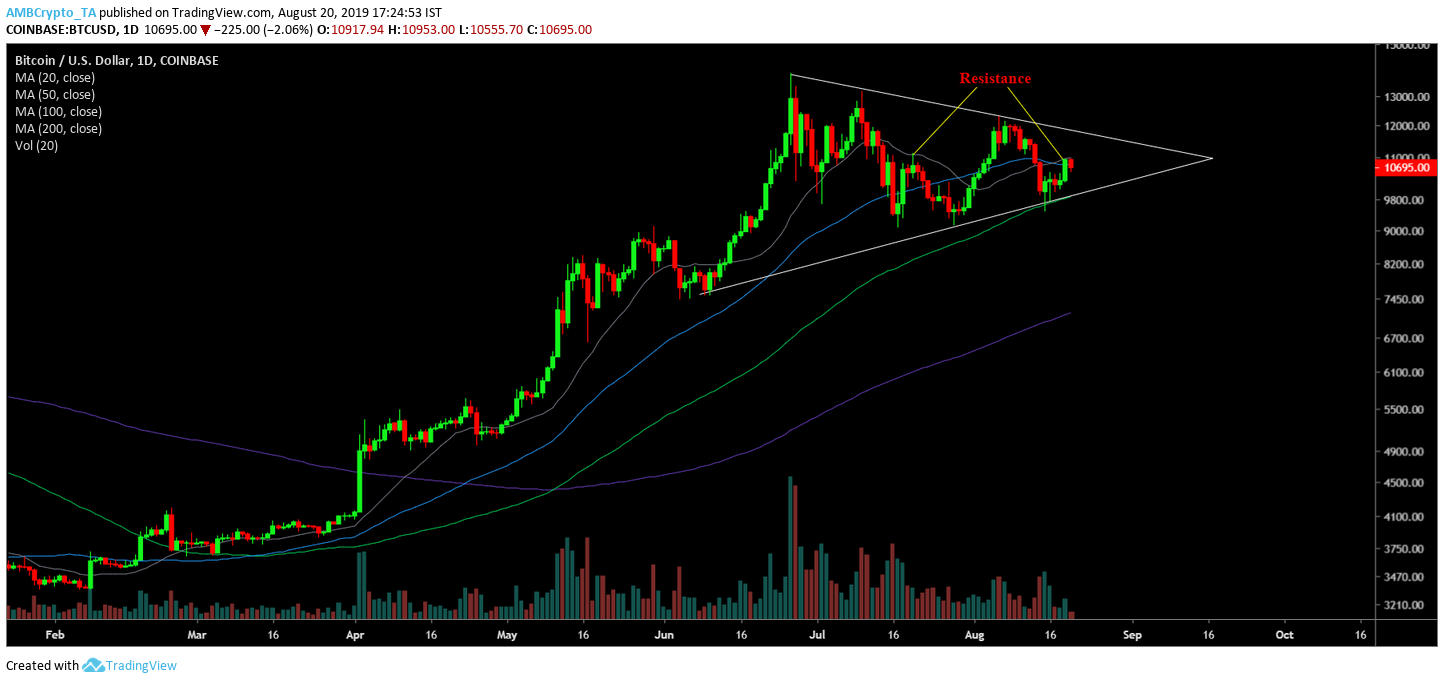
The daily chart for the same rising wedge shows that if the price does manage to close above the $10,700-level, it has a free pathway to $11,000 and could go as high as $11,400. Moreover, the daily chart shows that the price is getting tested by the 20 and 50-day moving averages, while being supported by the 100-day moving average. Putting two and two together, it seems that the breakout to the top seems less probable [unless the mentioned resistance levels get breached], due to the overhead nature of resistances present.
However, on a macro scale, the rising wedge pattern is engulfed in a bigger pennant pattern for over 8 weeks. The daily candle that was being formed at press time, was facing resistance formed by the previous peak on July 20. Factoring all of this would further indicate that a downtrend is more probable than an uptrend.
Target: The price, although less likely, if breaks to the upside would first breach the $11,000 mark, before further testing $11,250, and $11, 450.
Summary of Probable Outcomes
Rising Wedge
Breakout: Down
Target 1: $10,131
Target 2: $9,719


