
XRP’s price, despite a minor upside break, has failed to breach any significant resistances. In 2019, XRP was one of the worst-performing assets among the top ten cryptocurrencies by market cap. This trend has continued even in the second quarter of this year.
XRP
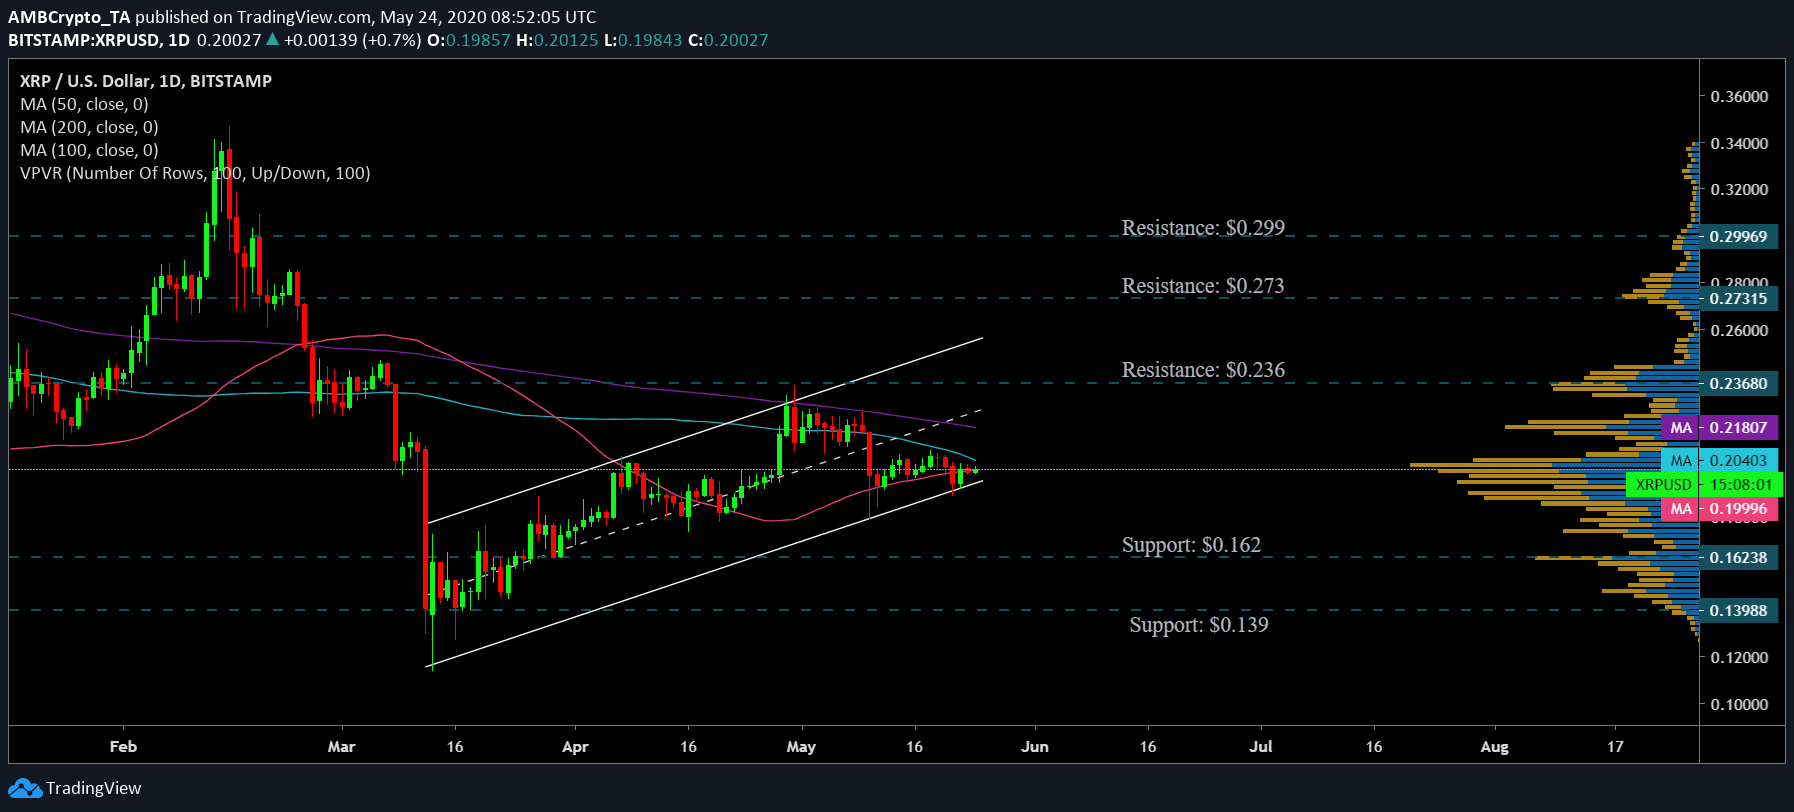
Source: XRP/USD on TradingView
XRP’s price has been moving along an ascending parallel channel since the 12th March crash. A breakout from this pattern was predicted to be a bearish one. This was supported by the daily moving averages which have been resisting the XRP price candles for more than two months now. The candles moved above the 50 moving average in the later part of April, but it struggled to retain the trend as the 50 DMA [Pink] went over the candles on 20th May.
Further validating the presence of bearish sentiment was the 200 DMA [Purple] and the 100 DMA [Blue] which were above XRP candles. Additionally, it was also observed from the above daily chart that attempts at a golden cross by the 50 DMA and the 200 DMA have been stalled even as the two remained close.
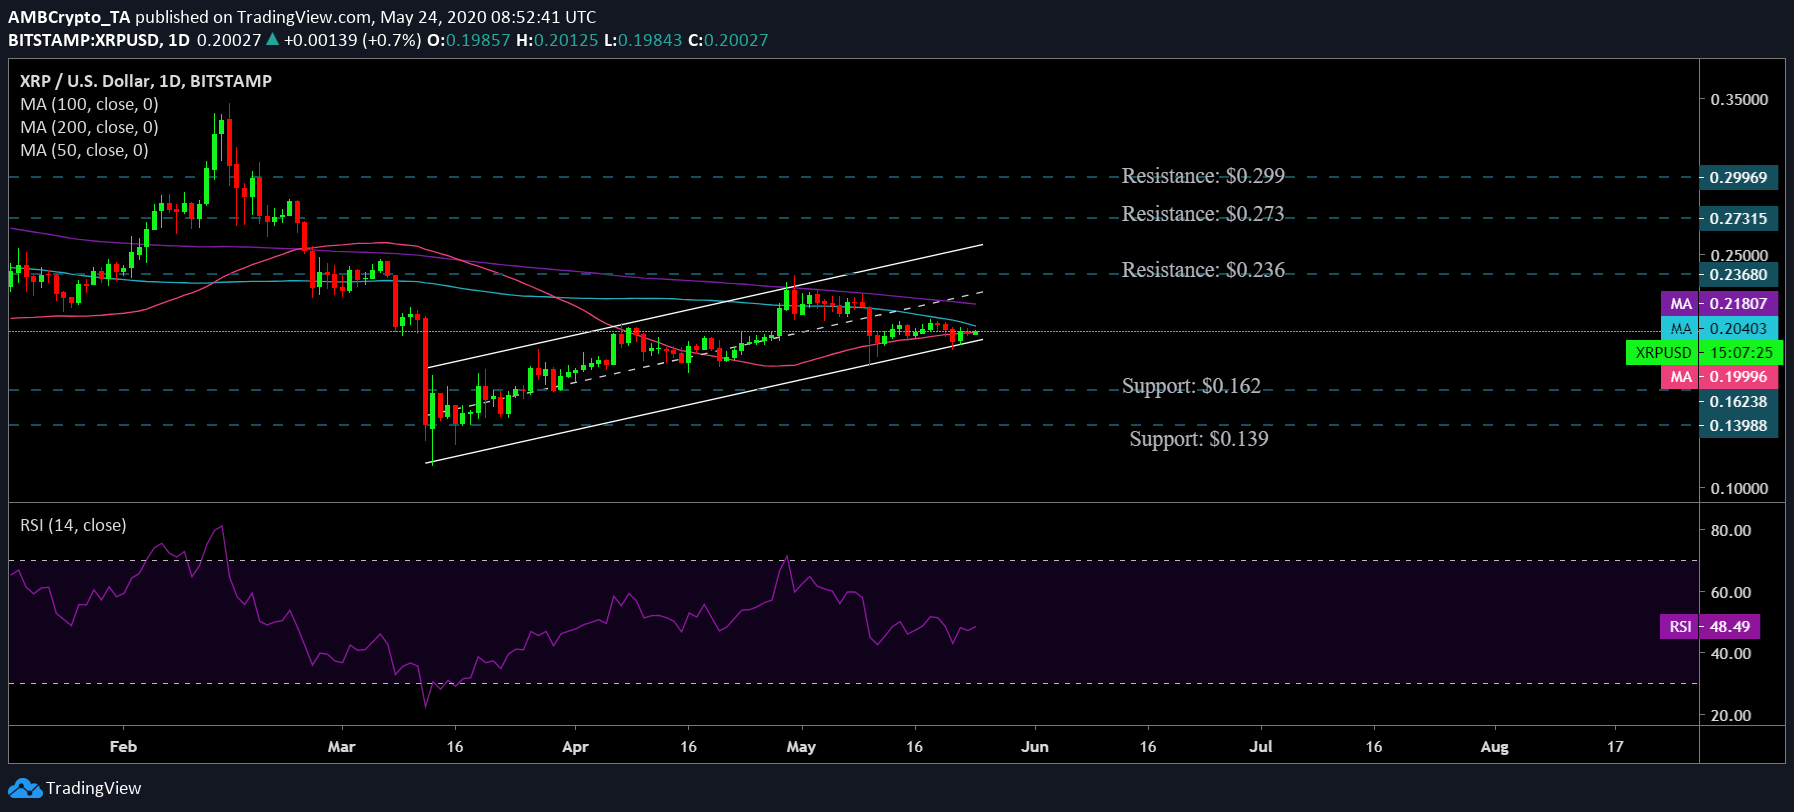
Source: XRP/USD on TradingView
RSI indicator was in the oversold zone depicting an overall sentiment of high-sell pressure among the investors in the market.
Case 1:
A bearish breakout for the coin in the long-term was supported by the ascending channel pattern formation, the placement of the moving average as well as the increasing sell-pressure depicted by the RSI indicator. In this scenario, XRP could retrace its steps back to support areas of $0.162 as suggested by VPVR indicator which noted a high trading activity. Additionally, if this trend persists, XRP could retest another support at $0.139, a level unseen since the third week of March.
Case 2:
In case of an unlikely scenario of a bullish flip, the resistance points, as depicted by VPVR, stood at $0.236, $0.273, $0.299.
Correlation:
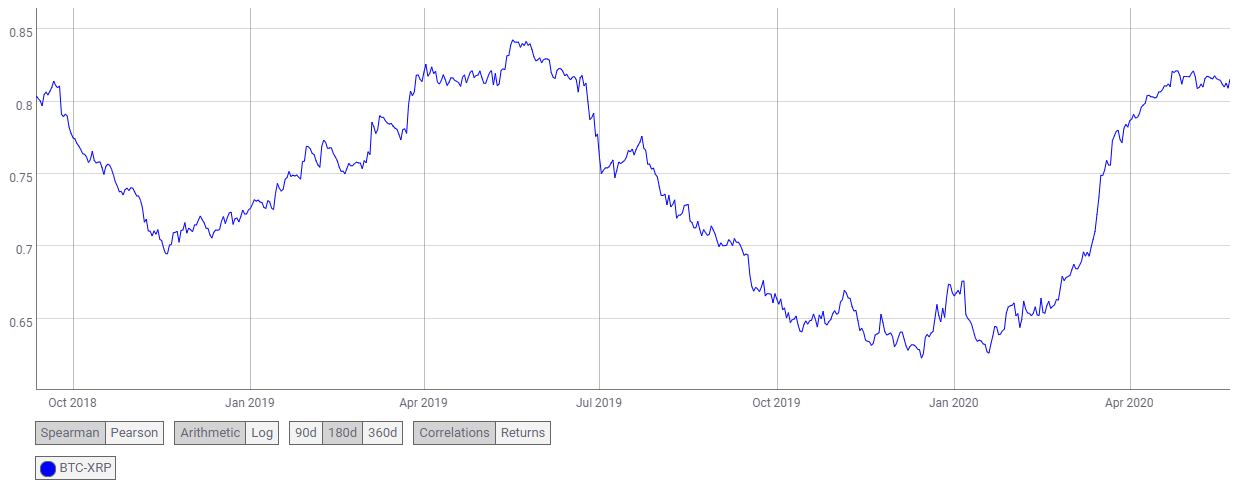
Source: Coin Metrics
The BTC-XRP correlation coefficient stood at 0.815 and it has been increasing since the beginning of the year from a low of 0.64. The increasing correlation would imply that XRP would closely follow BTC’s price movements and if the latter manages another rally, it would significantly catapult XRP’s price and even cause it to break crucial resistance points.
Conclusion:
The above charts depicted a bearish case for XRP in the offing which would drive its price to $0.162 and $0.139 support points while its resistance level stood firm at $0.236, $0.273 and $0.299.