
Recently, the eleventh largest cryptocurrency, ADA, recorded a six-month low as the price plummeted to $0.0378. However, the coin was seen recovering from this, recording a 2.33% increase in its price over the last 24 hours. At the time of writing, the price of the altcoin stood at $0.0405, while the market cap was at $1.05 billion. The 24 hour trading volume was noted to be $57.27 million, wherein most of it came from the CoinEx exchange via trading pair ADA/USDT.
The short-term chart for Cardano highlighted the strong presence of bulls in the ADA market.
1-Hour Price Chart
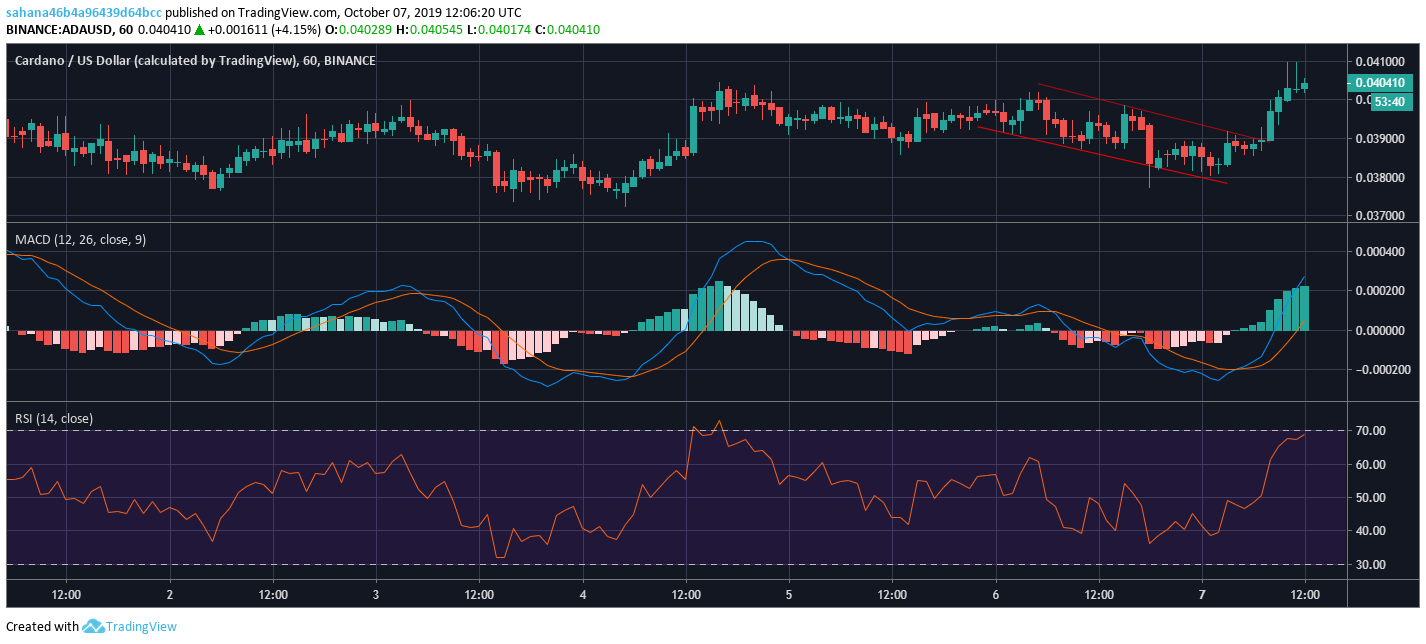
Source: ADA/USD on TradingView
The one hour chart exhibited two downward sloping trendlines, further forming a descending channel pattern. One of the trendlines in the chart formed lower highs at $0.0398, $0.0391 and $0.0389, whereas the other trend line formed lower lows at $0.0391, $0.0390 and $0.0386. Further, the pattern indicated a breakout in the upward direction. The descending channel pattern also revealed decreased volume throughout the channel. However, the volume seemed to be increasing as soon as the breakout.
The short-term chart for Cardano hinted at the strong presence of bulls as the MACD indicator formed a bullish crossover, with the signal line below the MACD line. The RSI indicator was also seen taking the side of the bulls as the marker was too close to the overbought zone.
4-Hour Price Chart
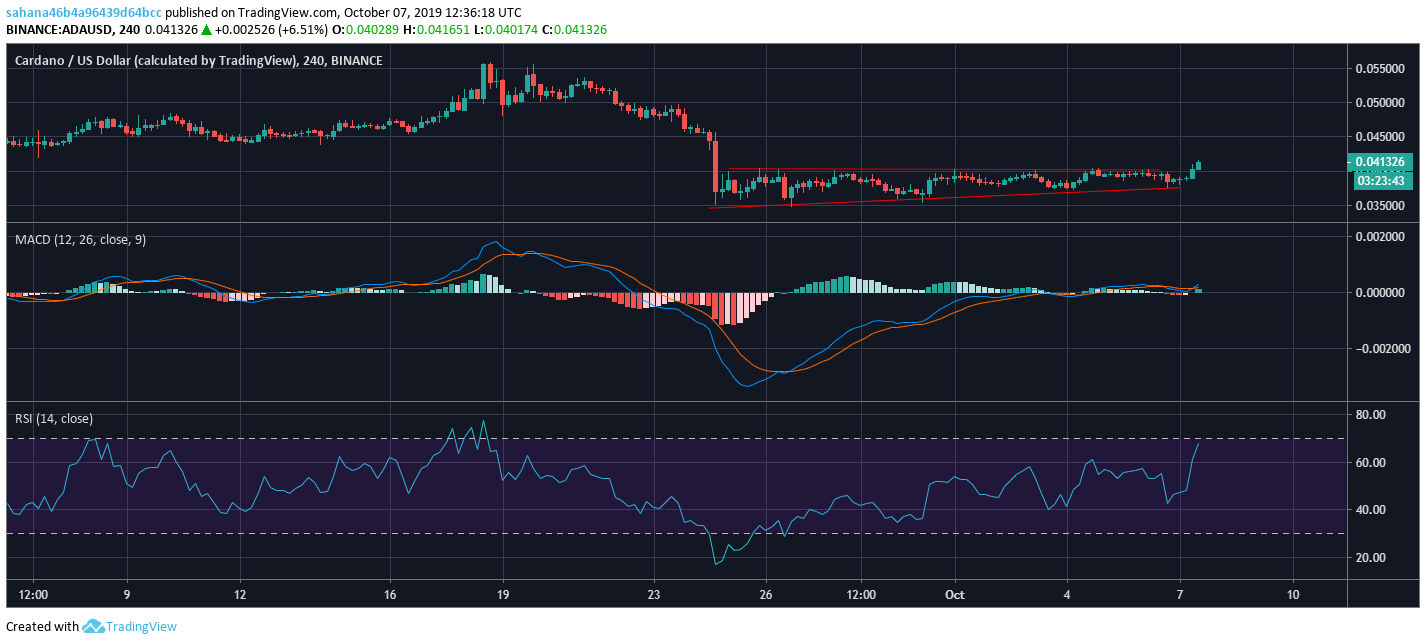
Source : ADA/USD on TradingView
The four-hour price chart for ADA formed an ascending triangle pattern where one of the trend lines formed a horizontal line, while the other trend line formed higher lows with resistance at $0.0374. The pattern that is formed in the chart suggests an upward breakout.
Key indicators like MACD and RSI also revealed the presence of the bulls in the ADA market. The MACD line was slowly climbing above the signal line, indicating a bullish crossover. The RSI indicator highlighted that ADA was heading towards the overbought zone.
Conclusion
The one-hour chart for Cardano formed a descending channel pattern, further causing an upward breakout, while the four-hour chart formed an ascending triangle pattern and also indicated an upward breakout. The key indicators in the short-term chart hinted at a bullish market.