
The Bitcoin halving was a major topic of discussion and debate towards the end of 2019, while also being so in early-2020. However, as Bitcoin surged in February, the topic faded as its price gained the spotlight. With only 41 days left for the halving, BitMEX’s research on the mining cost curve reveals interesting and potential possibilities post-halving.
Bitcoin mining cost curves
The present research report by BitMEX is the fourth in the Bitcoin halving series. In the same, BitMEX explored three possible curves for Bitcoin mining costs and compared them with the actual curve. The first curve is straight-forward, a liner cost curve, followed by a “Normal” cost curve, and quadratic cost curve.
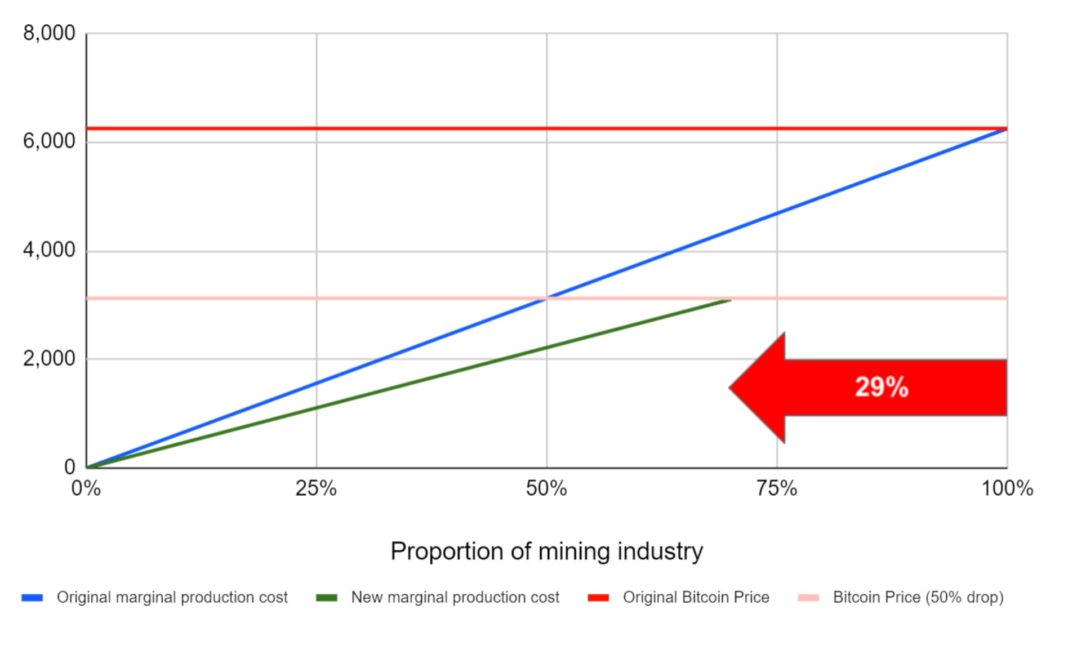
After the halving, Bitcoin rewards will be halved while the work done will remain the same. This is why the price of Bitcoin, post halving, in the research report, is assumed to be halved from $6000 to $3000.
Source: BitMEX Research
In the first mining cost curve [as seen above], which is linear, the green line is the new marginal production cost after halving, which intersects the price post halving at $3000. Based on these two data points, the hash rate is expected to drop by 29% after the third halving.
Source: BitMEX Research
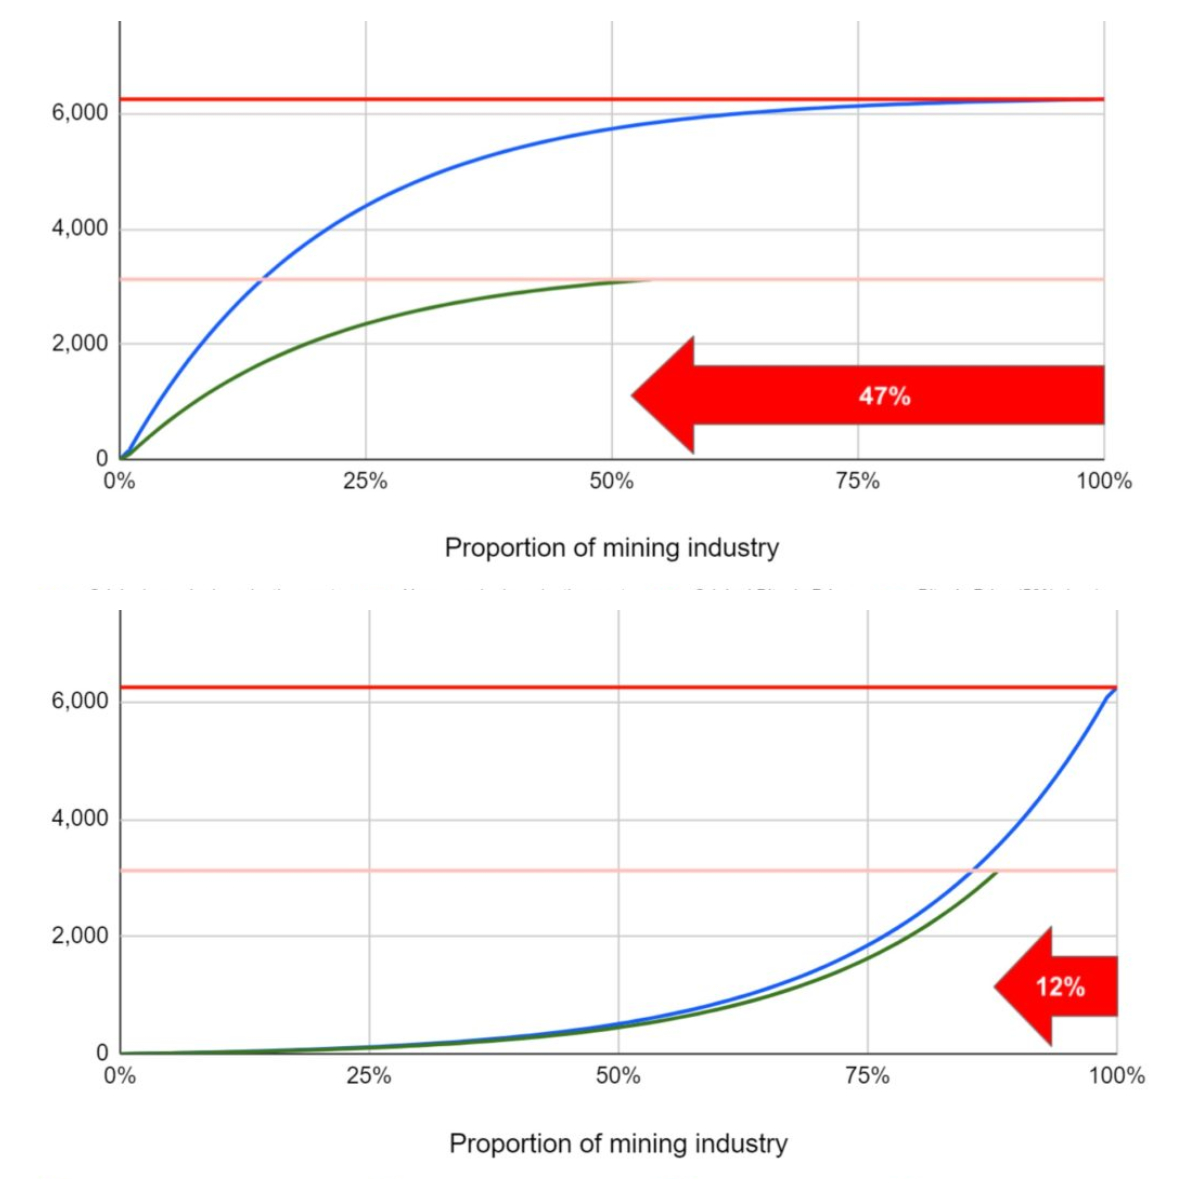
Similarly, the second cost curve, which is a “normal” curve, shows a drop in hash rate by 47% after the halving. For the third curve, there is only a 12% drop in hash rate.
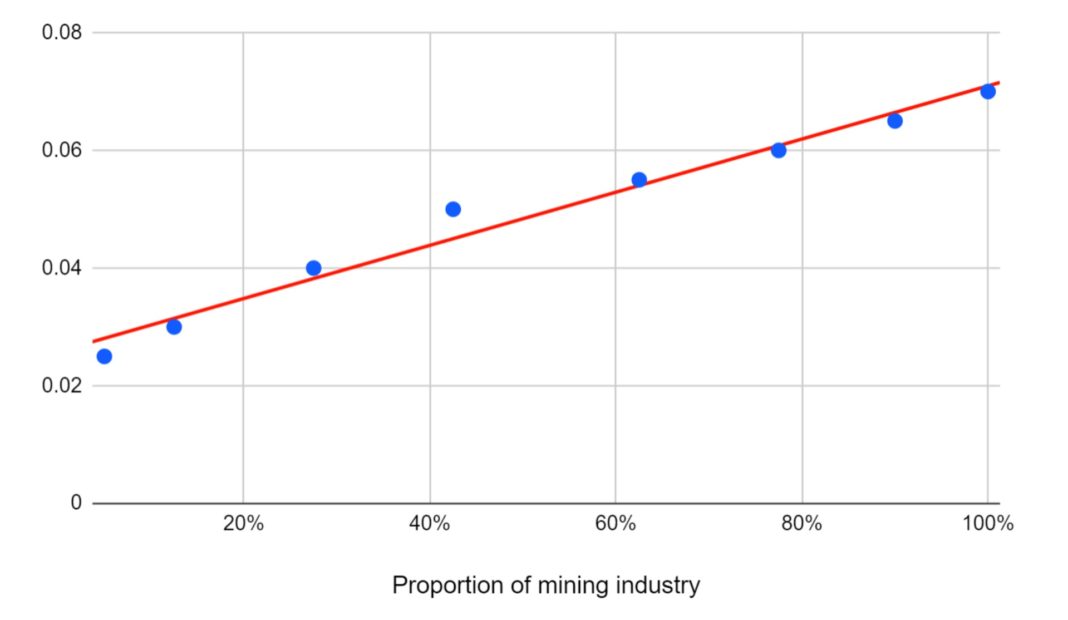
Since all these curves are based on theoretical data and actual data regarding Bitcoin’s mining industry is hard to come by, BitMEX research used data from Blockware Solutions’ recent research report which classified the mining industry based on electricity costs in eight different layers.
BitMEX’s research stated,
“It is difficult to assess the accuracy of the data, however we analysed the figures and produced the following cost curve. As the chart below shows the best fit line (in red) is reasonably linear, similar to scenario 1 in our charts above.”
Source: BitMEX Research
As seen, the plotted data resembles the liner cost curve; hence, it should be noted that this was based on consideration of electricity costs only.