XRP short-term Price Analysis: 23 June

Disclaimer: The conclusions of this analysis should materialize on the charts over the next 24 hours.
After spending close to 4 days under its resistance at $0.190, XRP briefly touched the important level during the early hours of 23 June. While a pullback right after saw the price drop down to $0.188, at the time of writing, an analysis would suggest that further movement should be expected over the next few days.
XRP remained 4th on the cryptocurrency rankings, behind Tether [USDT], at press time, with a registered market cap of $8.35 billion. However, over the past 24-hours, the significantly low trading volume of $1.83 billion was stalling any momentum in the XRP market.
1-hour XRP chart

Source: XRP/USD on TradingView
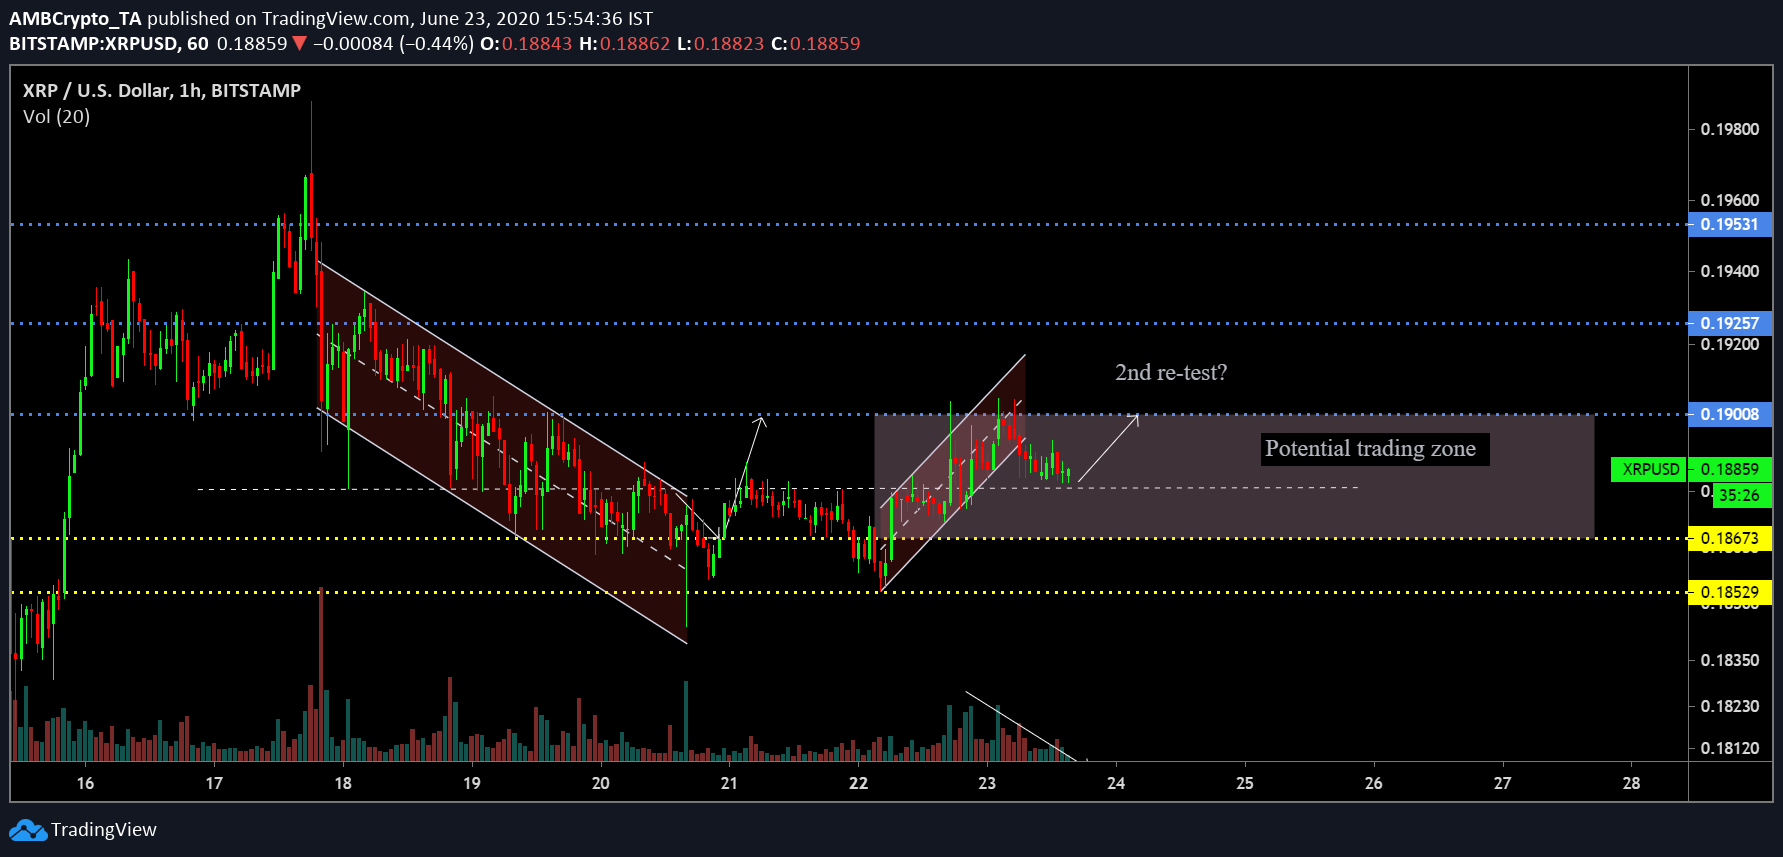
As observed in the attached chart, XRP’s valuation was oscillating between the trendlines of a descending channel from 17 June to 20 June, declining from $0.194 to $0.183. However, as previously predicted, the crypto-asset registered a bullish breakout and managed to consolidate at a higher range.
Although the initial target was to reach $0.190, the first pullback came after the crypto-asset touched $0.188 on 21 June. However, XRP re-tested its resistance at $0.190 on 23 June 02:30 UTC, before sliding back down to $0.188.
At press time, the lack of any significant bullish momentum was evident, hence, a breach above $0.190 seems unlikely. The psychological pullback support (white line) remained at $0.187, which should be XRP’s immediate base, however, the trading zone for the crypto-asset remained between $0.190 and $0.186.
Over the past 24-hours, XRP registered a bearish breakdown from an ascending channel and the pullback underlined may possibly point to another re-test at 0.190 in the next few hours.
Furthermore, the drop in trading volume, alongside the price, implied a trend reversal as well.

Source: TradingView
Market indicators favored the bearish side of the market as the MACD line remained under the signal line on the charts. Further, the Relative Strength Index or RSI suggested a neutral trend, but the selling pressure may gain further momentum on the charts.
Conclusion
XRP unlikely to breach $0.190 over the next 24 hours. The trading zone between $0.190 and $0.186 will hold strong until the end of June.


