XRP short-term Price Analysis: 18 August

Disclaimer: The following price prediction should not be taken as investment advice as it is the sole opinion of the writer. The price movement should be foreseeable in the next few hours.
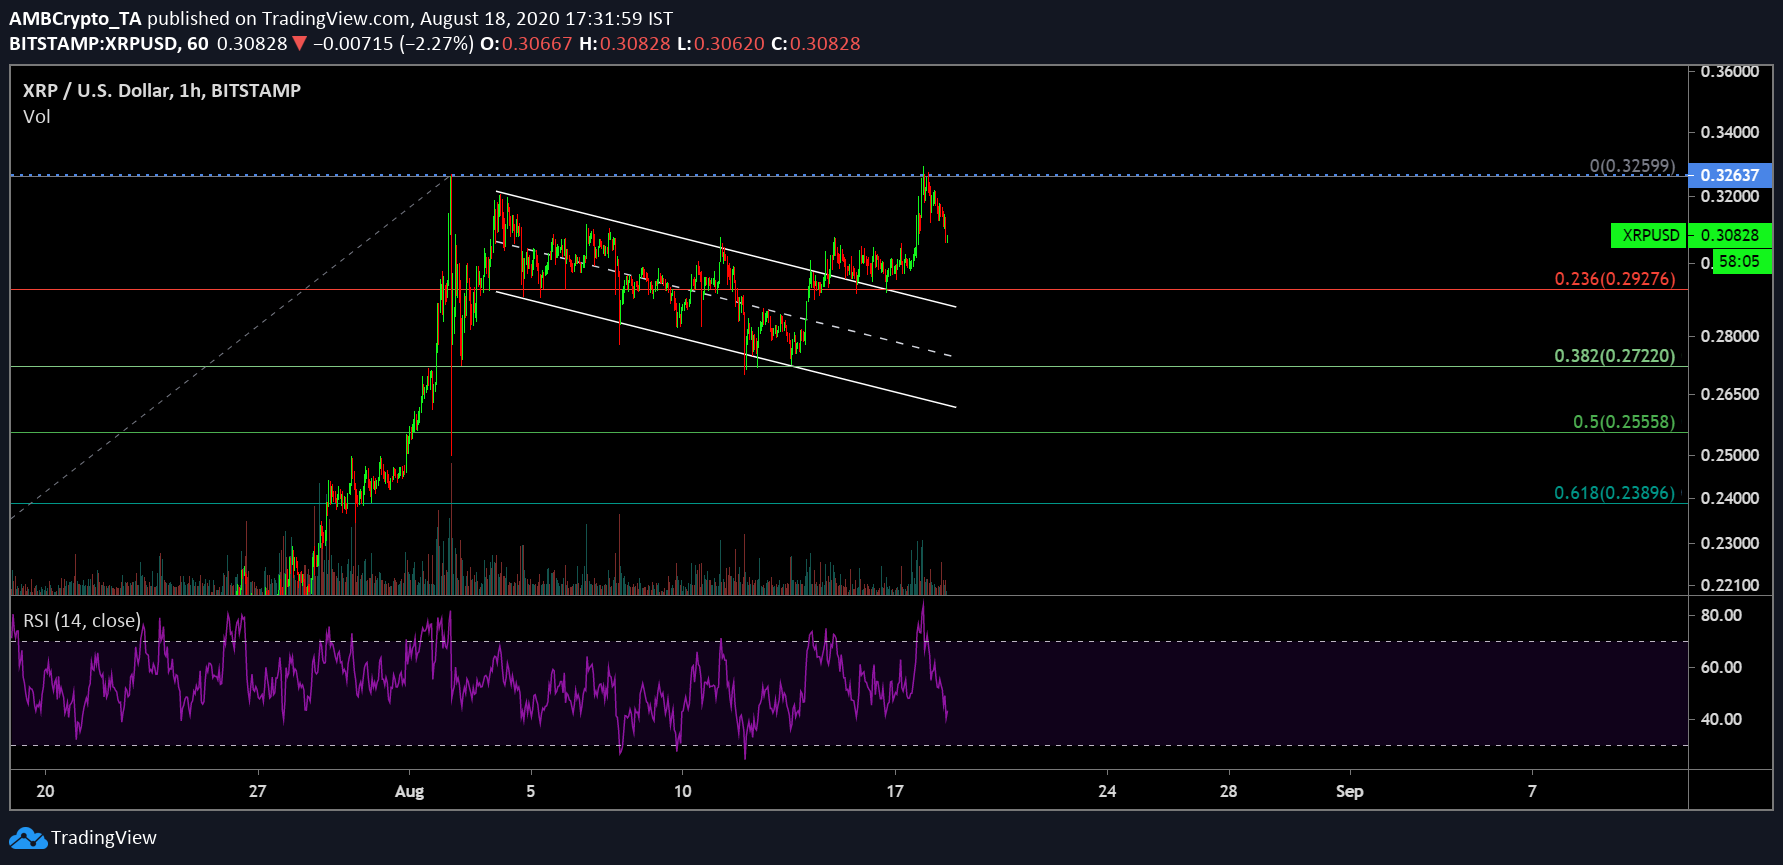
Since closing in on $0.32, XRP’s price has remained at a higher range between $0.272 and $0.323 in the chart over the month of August. Although the price did correct itself during the first week, as press time, it was comfortably above $0.2972.
XRP’s market cap remains $400,000 shy of the $14 billion mark.
XRP 1-hour chart

Source: XRP/USD on Trading View
As illustrated in the charts, XRP was observed to be under a descending channel from the 1st week of August. Depreciating down to the support of $0.272, the price bounced back from the price line and underwent a bullish break from the pattern to re-test $0.326 once again. For XRP, a decline is taking shape now as well but it is important to note that the support at $0.292 is strong as well.
Fibonacci Resistance is currently attested to three key resistance points. Maintained at $0.272, $0.2926, and $0.325.
With Relative Strength Index or RSI indicative of reaching an oversold position, a reversal can be expected within the next few hours, opening up a good long-position opportunity.
XRP 30-min bullish chart

Source: XRP/USD on Trading View
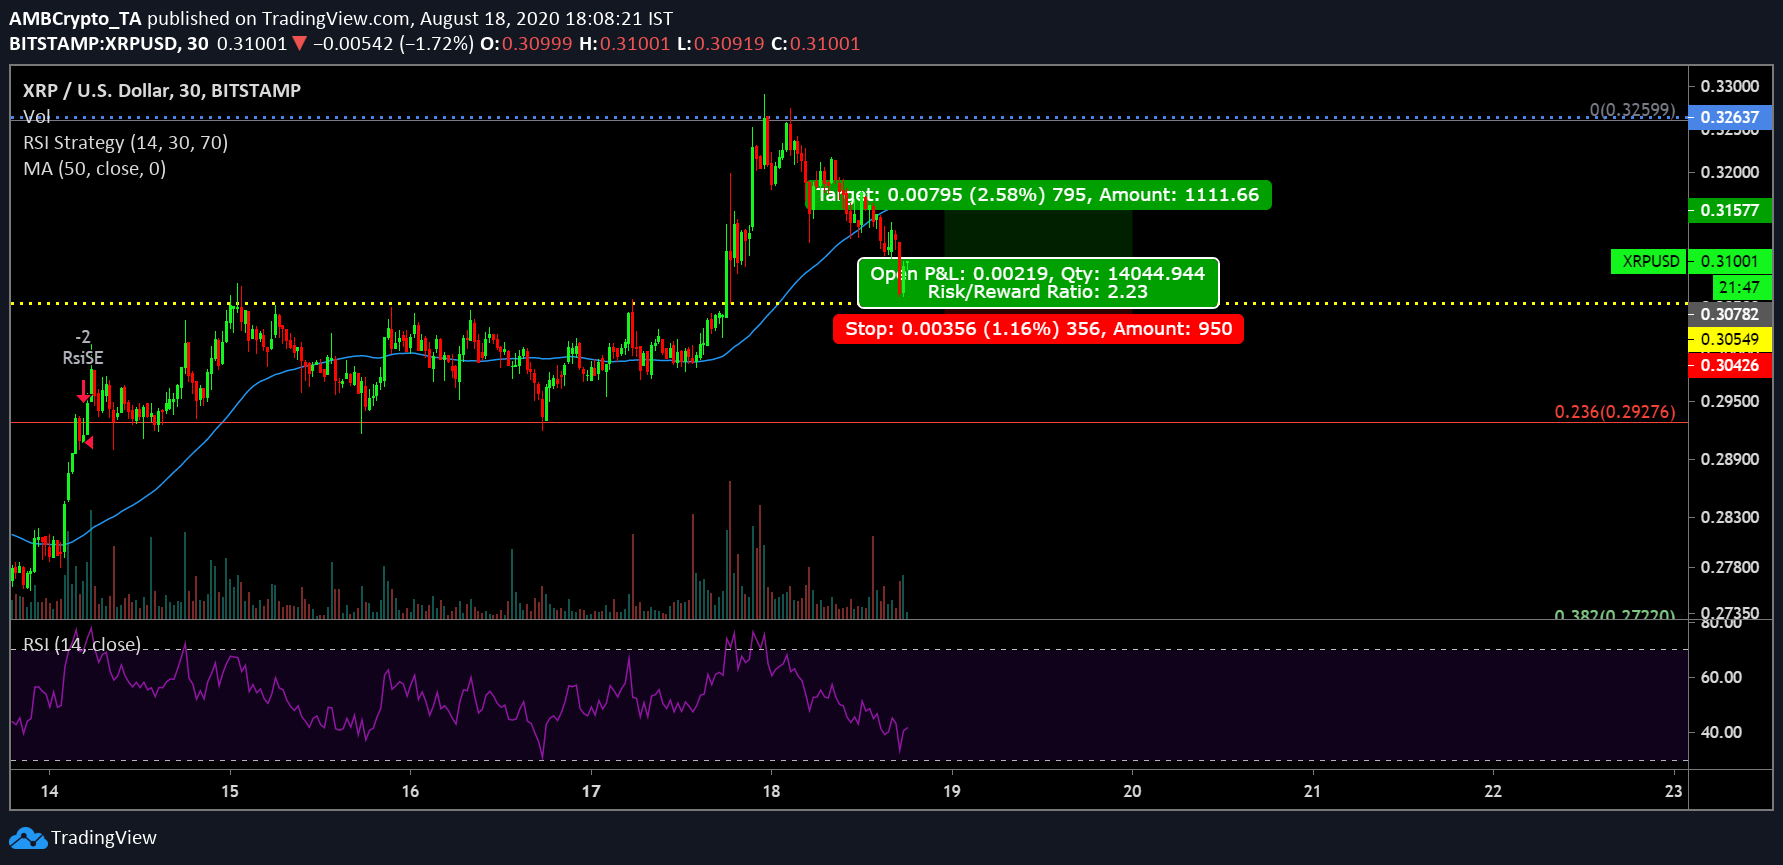
Now, looking at the 30-min chart of XRP, the support at $0.305 is evident, hence a long-position can be opened from this point forward. The main thing to be considered here in the pressure sustenance by the 50-Moving Average as it is currently above the candles, hence it is possible that the price pullback will occur at some point in time.
Keeping the current market in mind, an entry position for the price can be placed at $0.307 and a steep stop loss is to be kept at $0.304. Profits should be taken somewhere at $0.315 where the 50 Moving-Average is currently sustaining an overhead resistance.
Conclusion
Over time the next few days, XRP’s value is bound to retrace the price at $0.324 again but the Moving Average needs to be monitored in order to understand the retracement position of the chart.


