XRP could rise to $0.297 next week after quick correction

While the ascent of XRP to the $0.35 level earlier this month was very exhilarating, it left investors with much to be desired after its fall to the $0.26 range over the next two weeks. However, all may not be lost as the hourly chart showed that appreciation may be in the future for XRP’s short-term. According to CoinMarketCap, the coin had a market capitalization of over $12.32 billion and recorded a 2.62% rise over the last 24-hours.
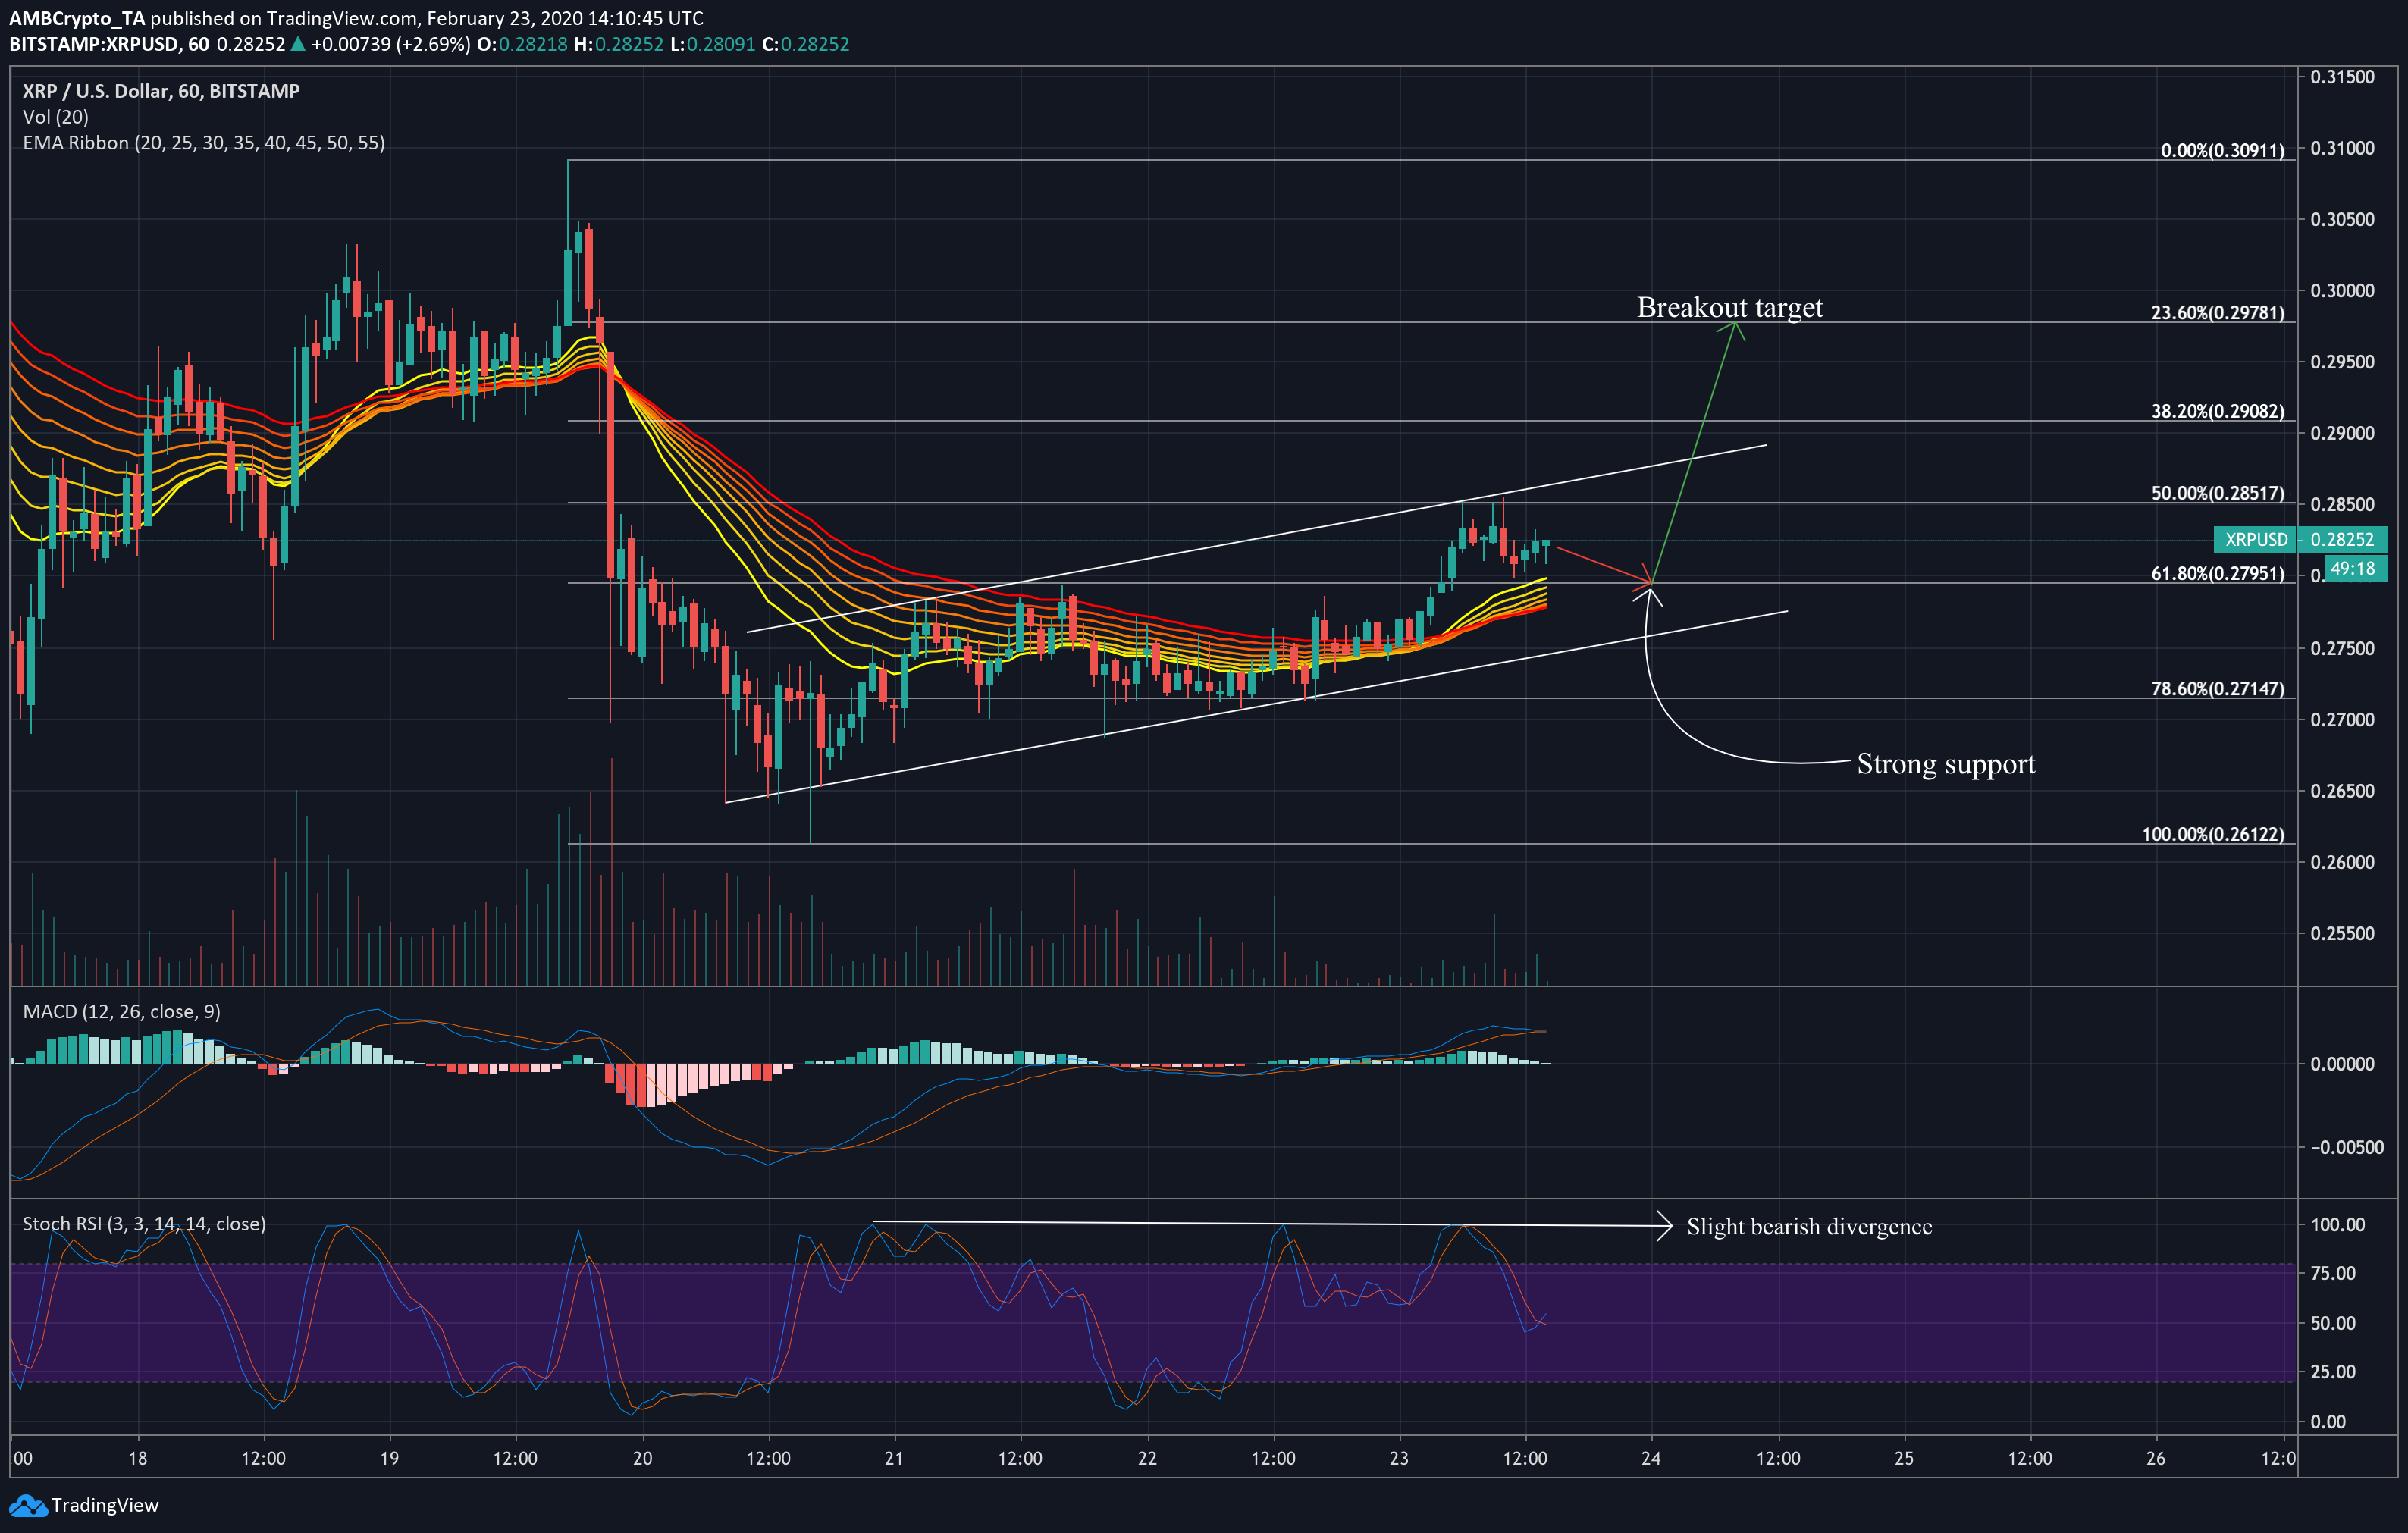
XRP 1-hour chart

Source: XRP/USD on TradingView
XRP appeared to have entered an ascending channel formation during the third week of February, accompanied by a decreasing volume trend. While these patterns tend to exhibit bullish and bearish breakouts equally, indicators support the case for XRP’s short-term appreciation.
However, following a brief test of the 50% Fibonacci retracement line support ($0.285), XRP could be in for a correction. The MACD looked poised for a bearish crossover and the relative strength indicator also presented some mild bearish divergence.
The EMA Ribbon lines, however, were moving under the price candles and will likely provide additional support at $0.28, the 61.8% Fibonacci retracement level. Further, the ribbons seemed to be diverging from a mean-reversion and could facilitate an explosive upward movement in the short-term.
It is likely that XRP will move down to the $0.28 level in the next couple of days. From here, a bounce-back to the upper trend line seems probable, given the strong historical support at this level. A breakout from the pattern will likely follow and could push XRP to the $0.297 mark in the coming week.
Volatility

Source: CoinMetrics
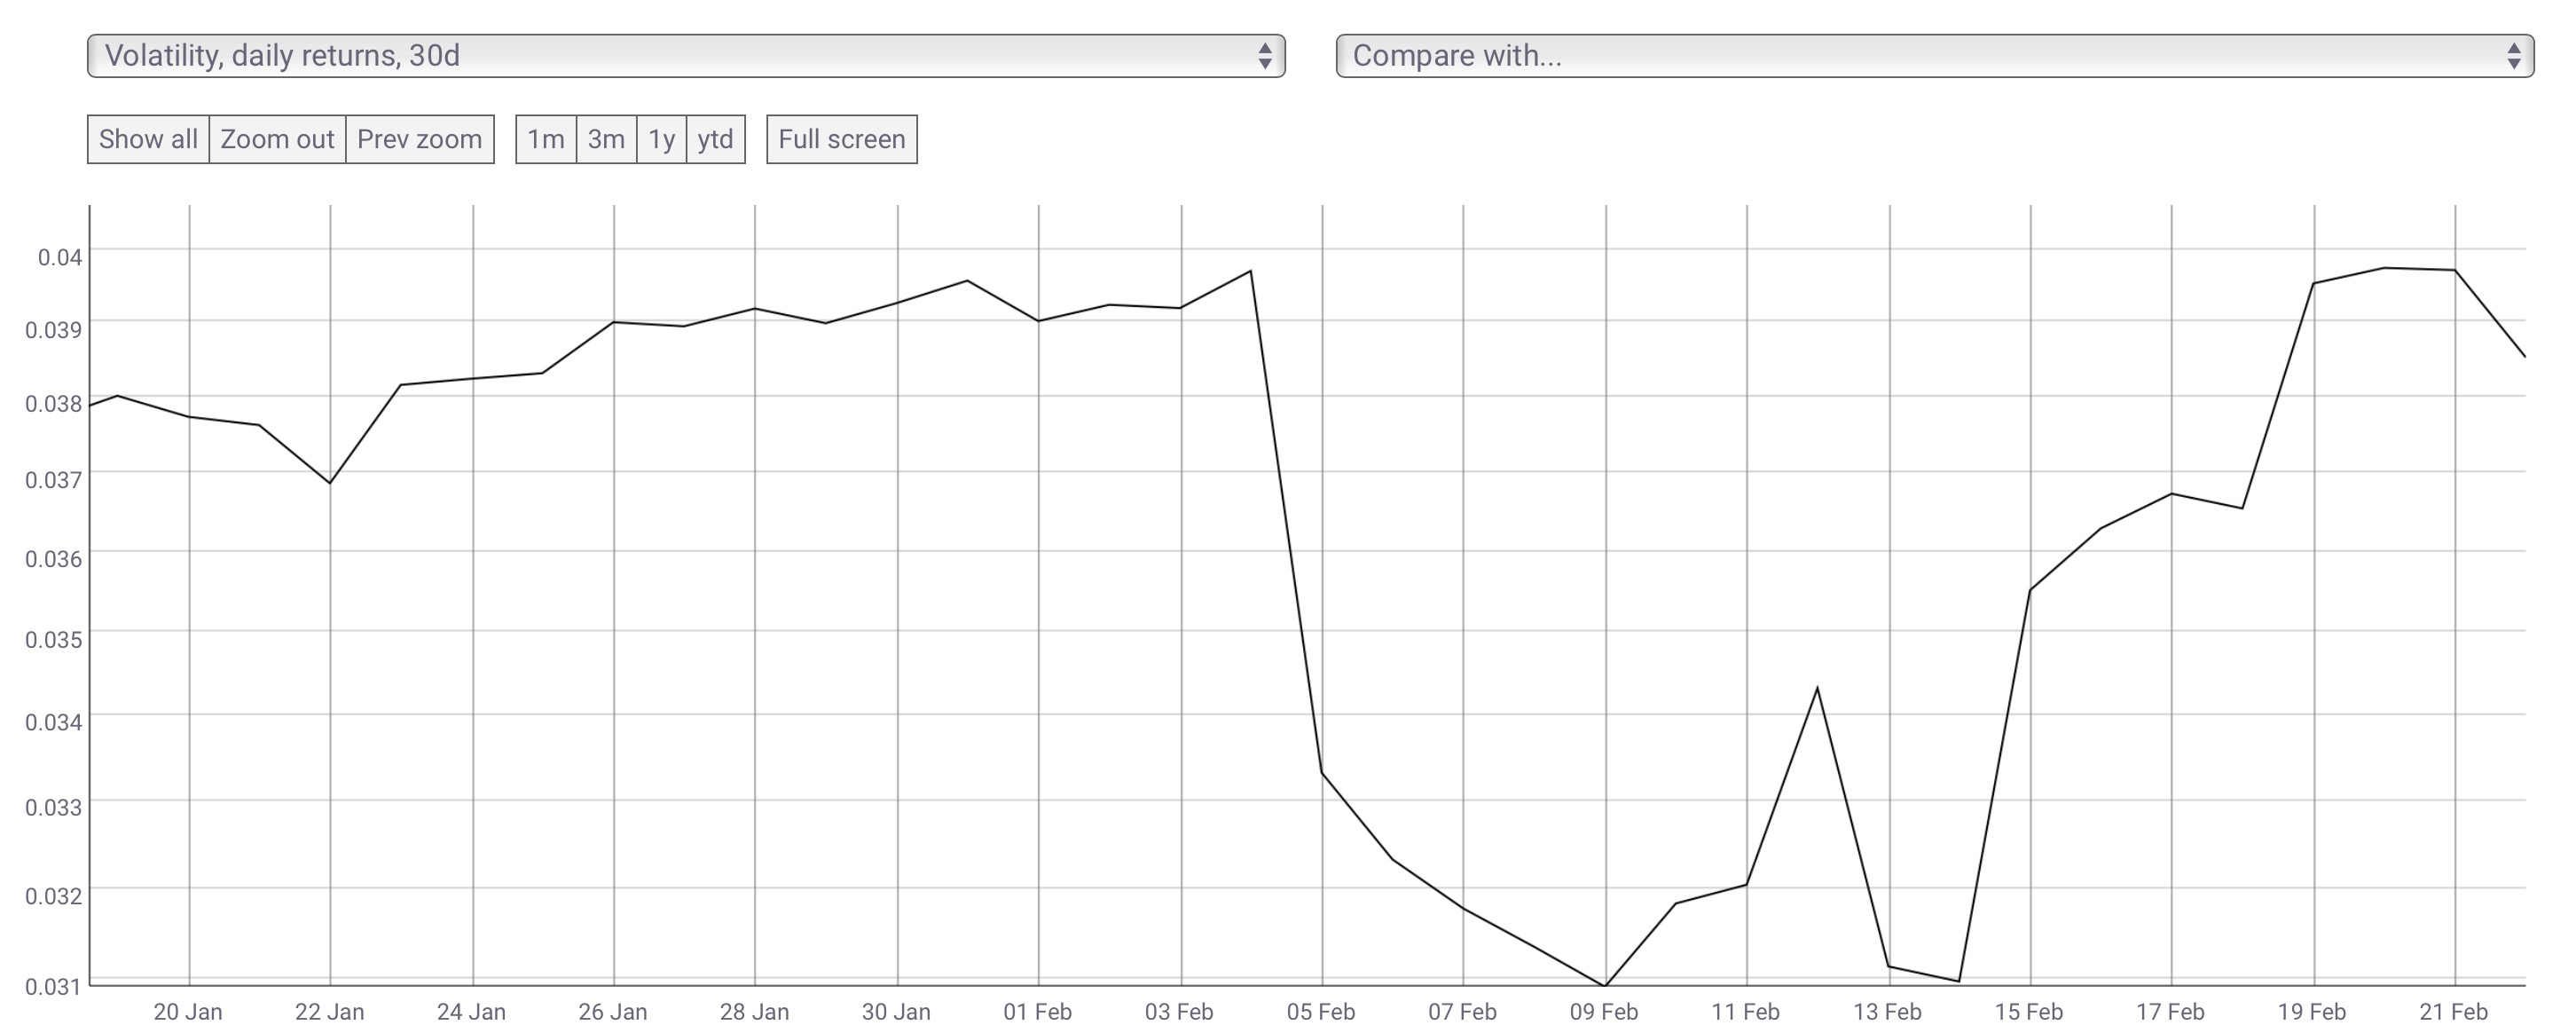
CoinMetrics, a blockchain data analytics firm, reported recently that XRP volatility based on 30-day returns is back to its late-January levels, near 0.04, after a two-week dip down to the 0.03 level. While volatility works both ways, this could be a sign of major bullish movements in the near future.
Conclusion
With the MACD on the verge of a bullish crossover and the RSI reporting a slight bearish divergence, XRP will likely move down the $0.28 level in the next few days. Finding strong support at this level, combined with the bullish prophecy form the EMA Ribbon lines, the cryptocurrency will likely appreciate to the upper trend line, before breaking out to the $0.297 level in the days that follow.


