XRP could pump to $0.209 in the short-term; long-term less rosy

Since 16 December, XRP has been hovering around the $0.19 mark, with intermittent dips under $0.185 and rises around $0.198. With a value of around $0.191 at the time of writing, XRP could be in for a short-term rise in value, despite its less-optimistic long-term prospects.
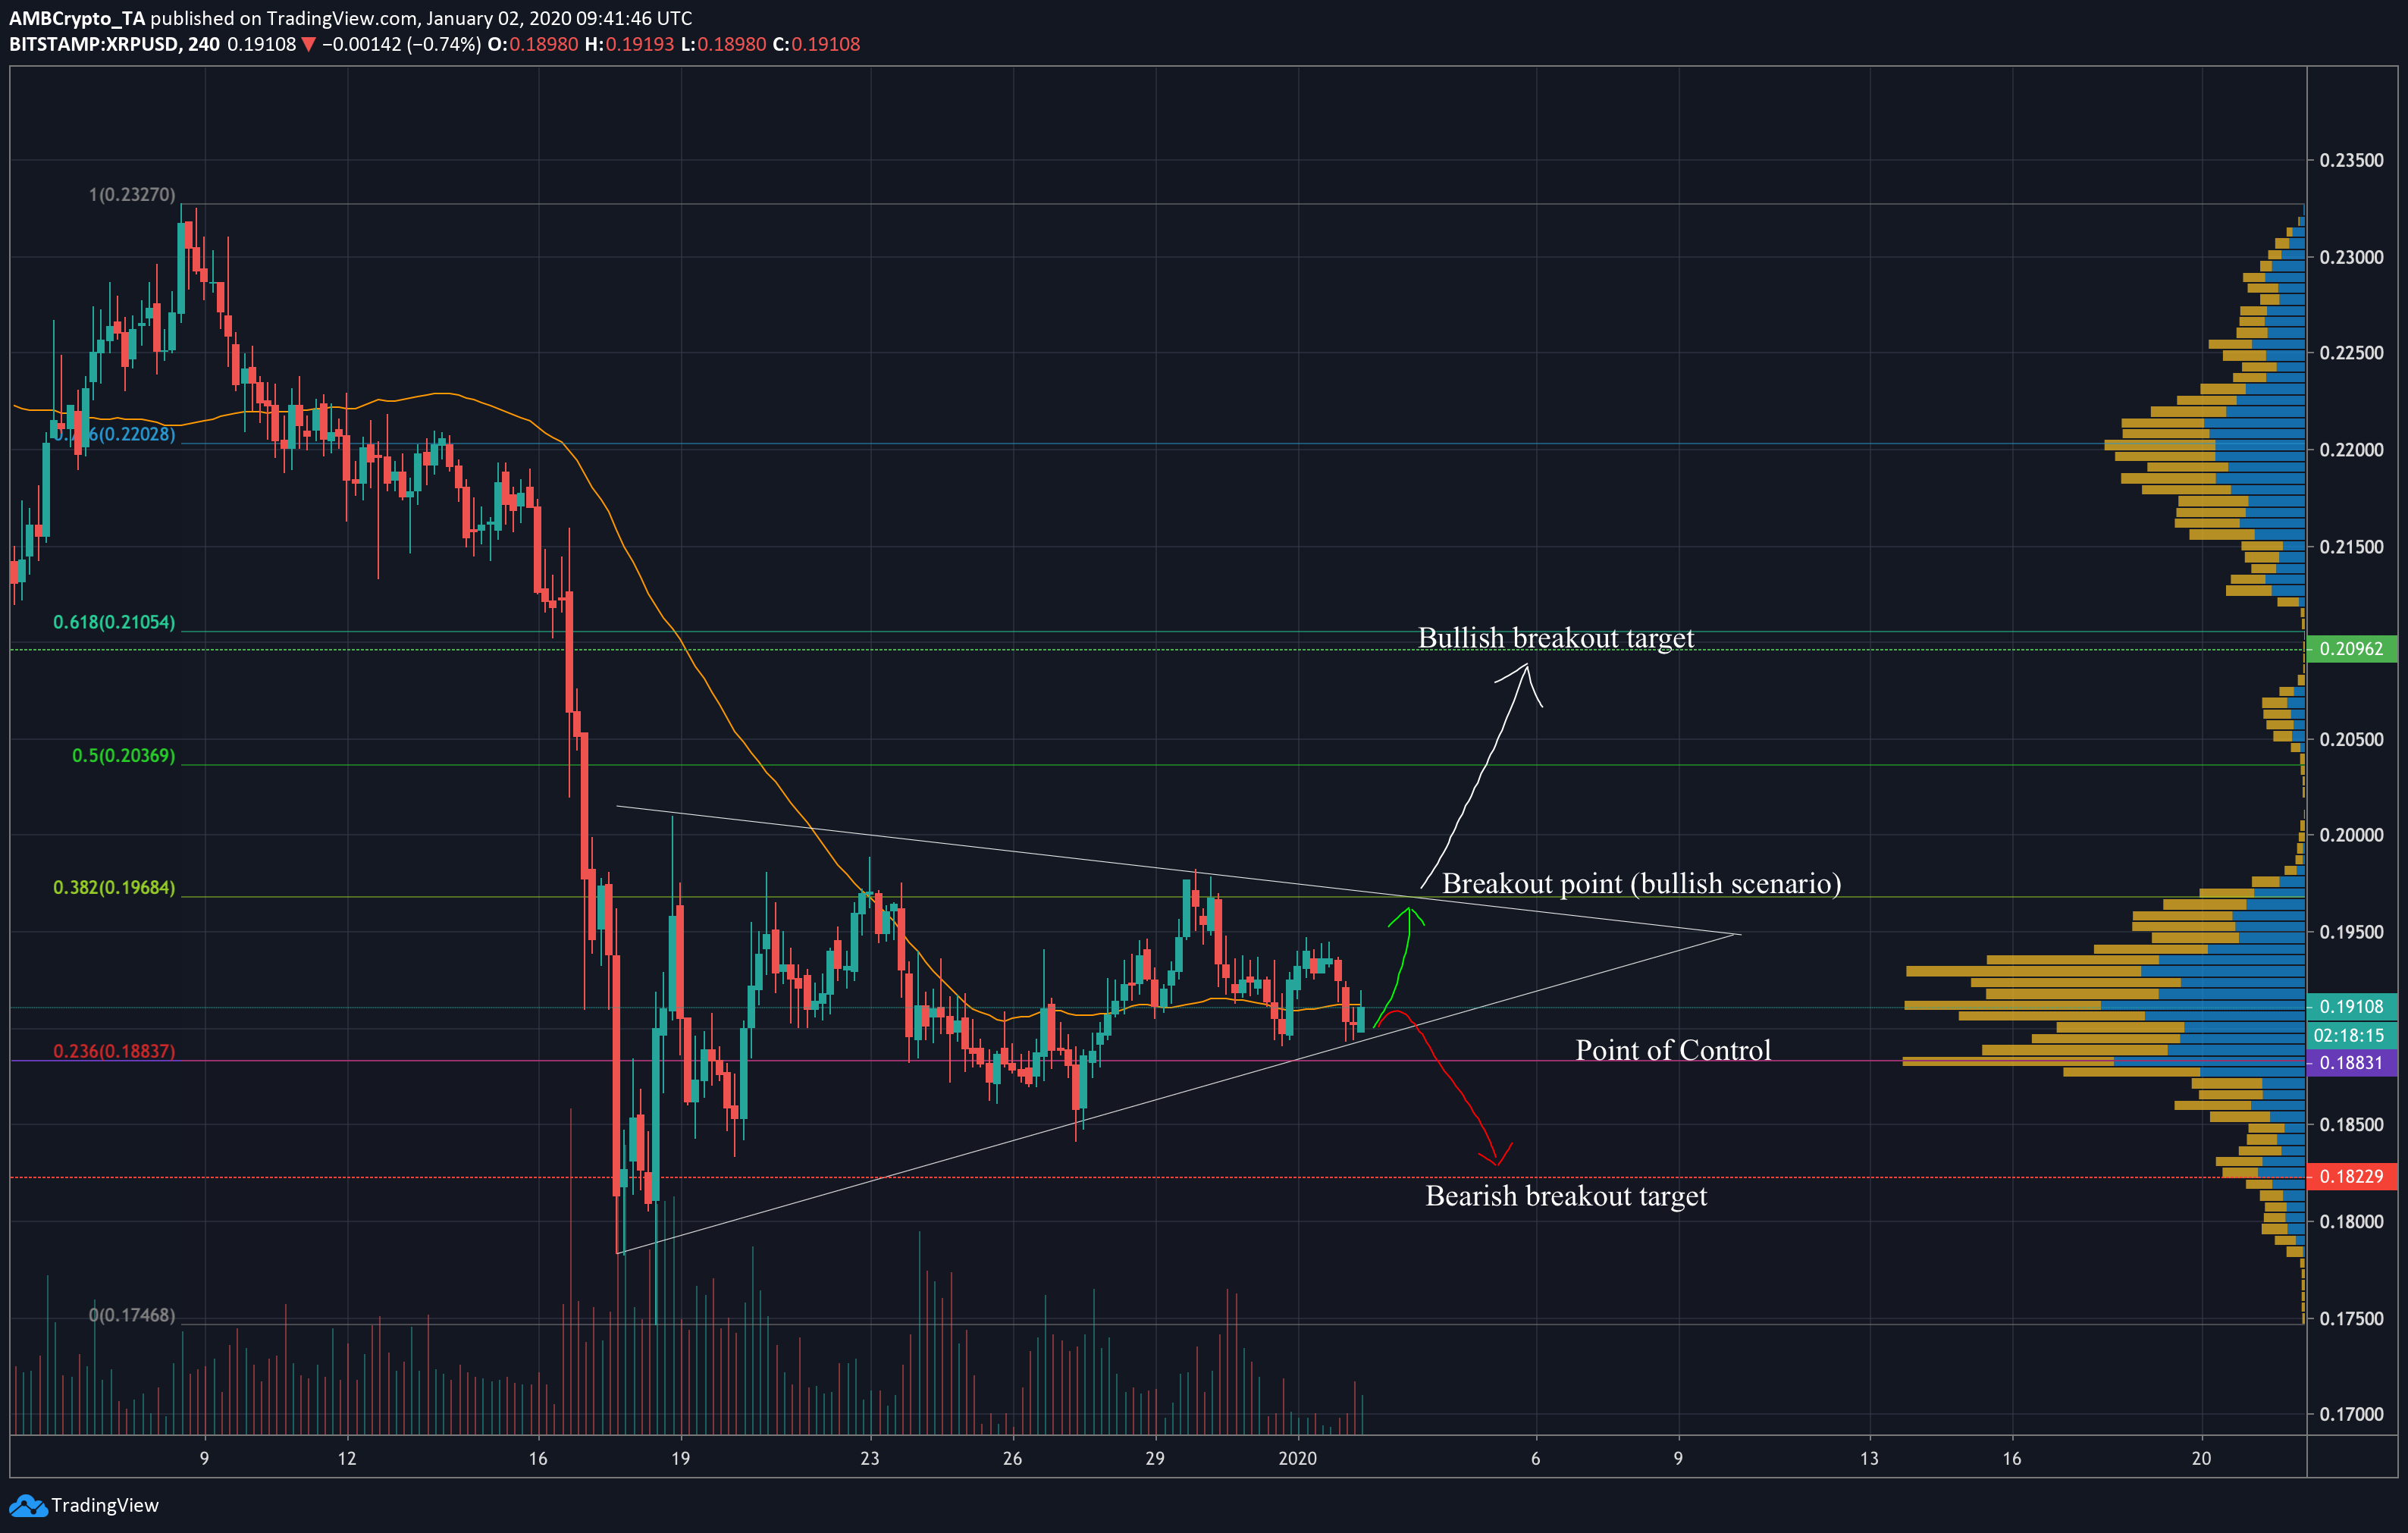
XRP 4-hour chart

Source: XRP/USD on TradingView
Following a 20% loss of value in less than three days, XRP dropped into a symmetrical triangle formation on 18 December, a pattern that tends to break-out upwards in 60% of all cases. These breakouts tend to happen 73-74% of the way to the triangle apex, giving us a tentative breakout date of 3 January — tomorrow.
The 50-MA could be seen intersecting the latest 4-hour candle, giving XRP a chance to cross above it into a more bullish case. With volume trending downwards over the pattern, which occurs in 86% of all symmetrical triangle formations, XRP’s value could move up to the breakout point at $0.196 or down below the Point of Control on the volume profile within the next day.
Assuming XRP is able to push above the immediate resistance from the 50 MA, a climb to the breakout point at the upper pattern boundary seems plausible, with a potential pump to just under the 61.8% Fibonacci retracement line likely following.
If XRP manages to maintain its value for the next 8-12 hours, a breakout from the lower pattern boundary could push it down to $0.182.
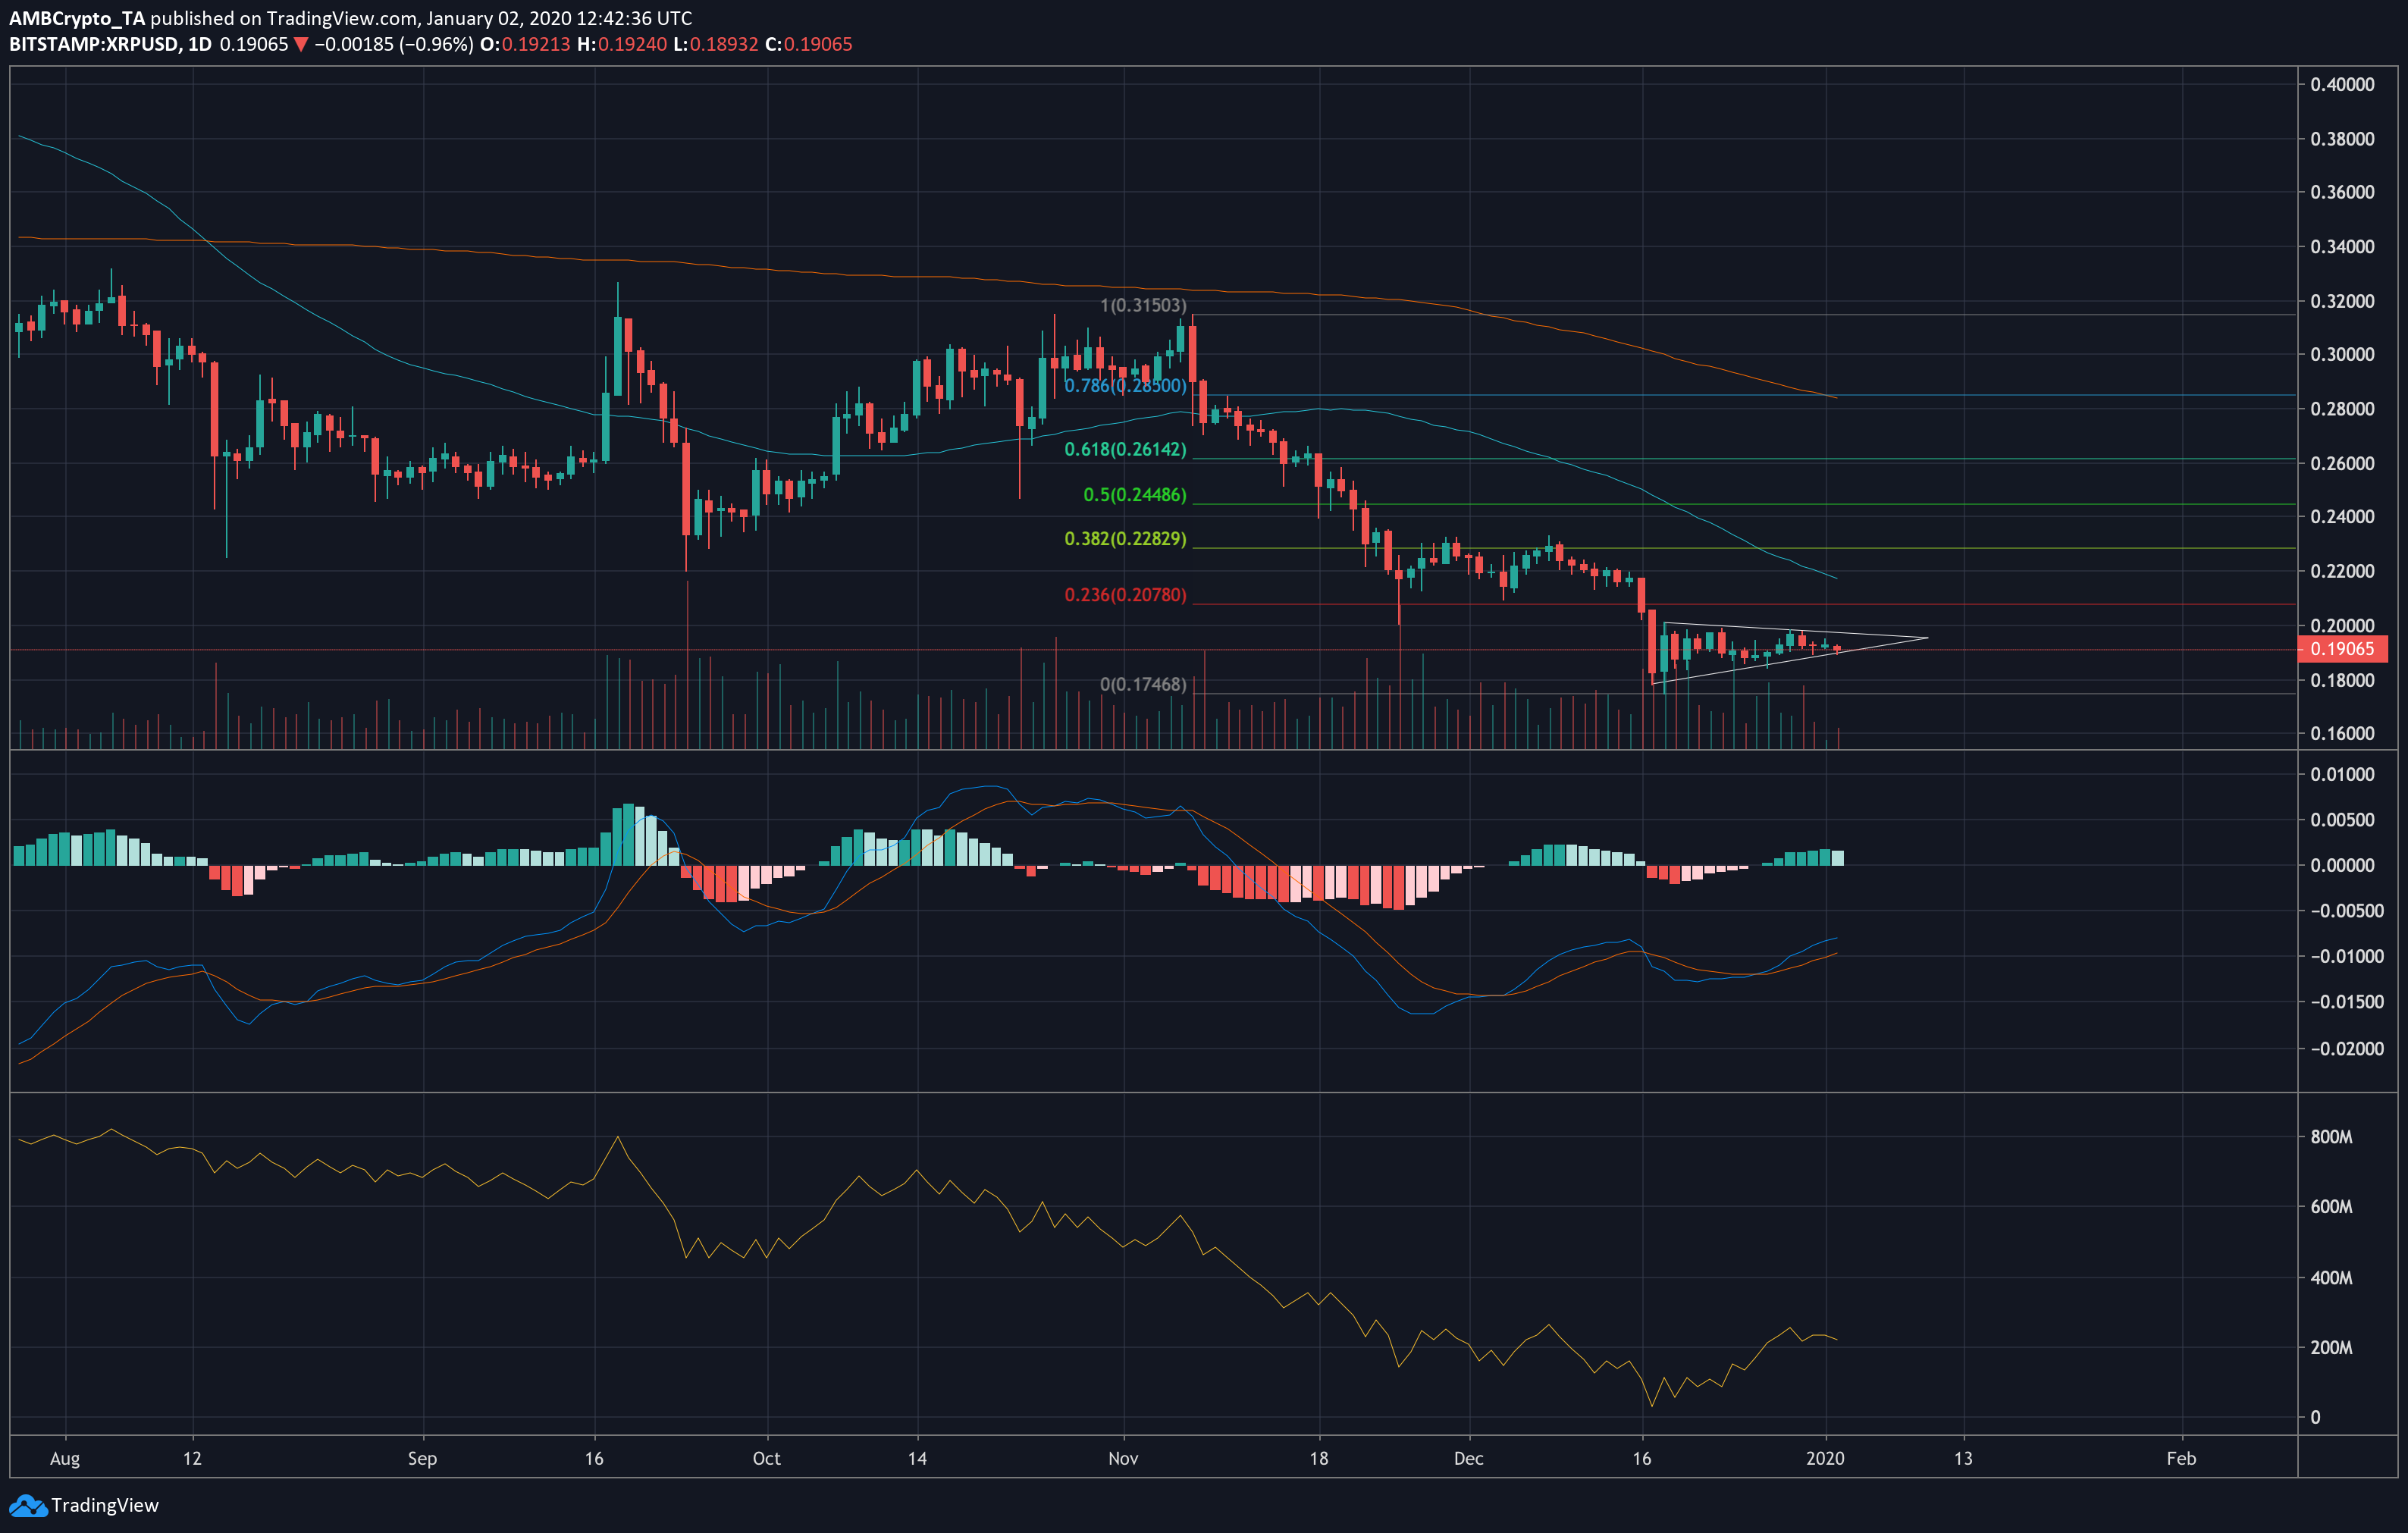
XRP 1-day chart

Source: XRP/USD on TradingView
The 1-day chart showed both the 200 and 50-day moving averages looming far above the price line, each of which underwent a death cross in mid-August and highlighted further bearish movement in the long-term. The MACD appeared bullish, however, with the blue MACD line having crossed over the signal line towards the end of December.
The on-balance volume indicator was moving just above the 200M mark, having been on the rise since 16 December. However, it seems to have hit resistance at the 260M mark, a mark which it failed to cross between late-November and early-December. This could predict a drop in OBV, further affirming that a drop in price could be in store for XRP in the long-term.
Though long-term prospects looked unfavorable overall, with the price moving just above the $0.187 support line, the moving averages appeared to dip downwards and in light of the bullish signal from MACD, we could see a short-term rise in price.
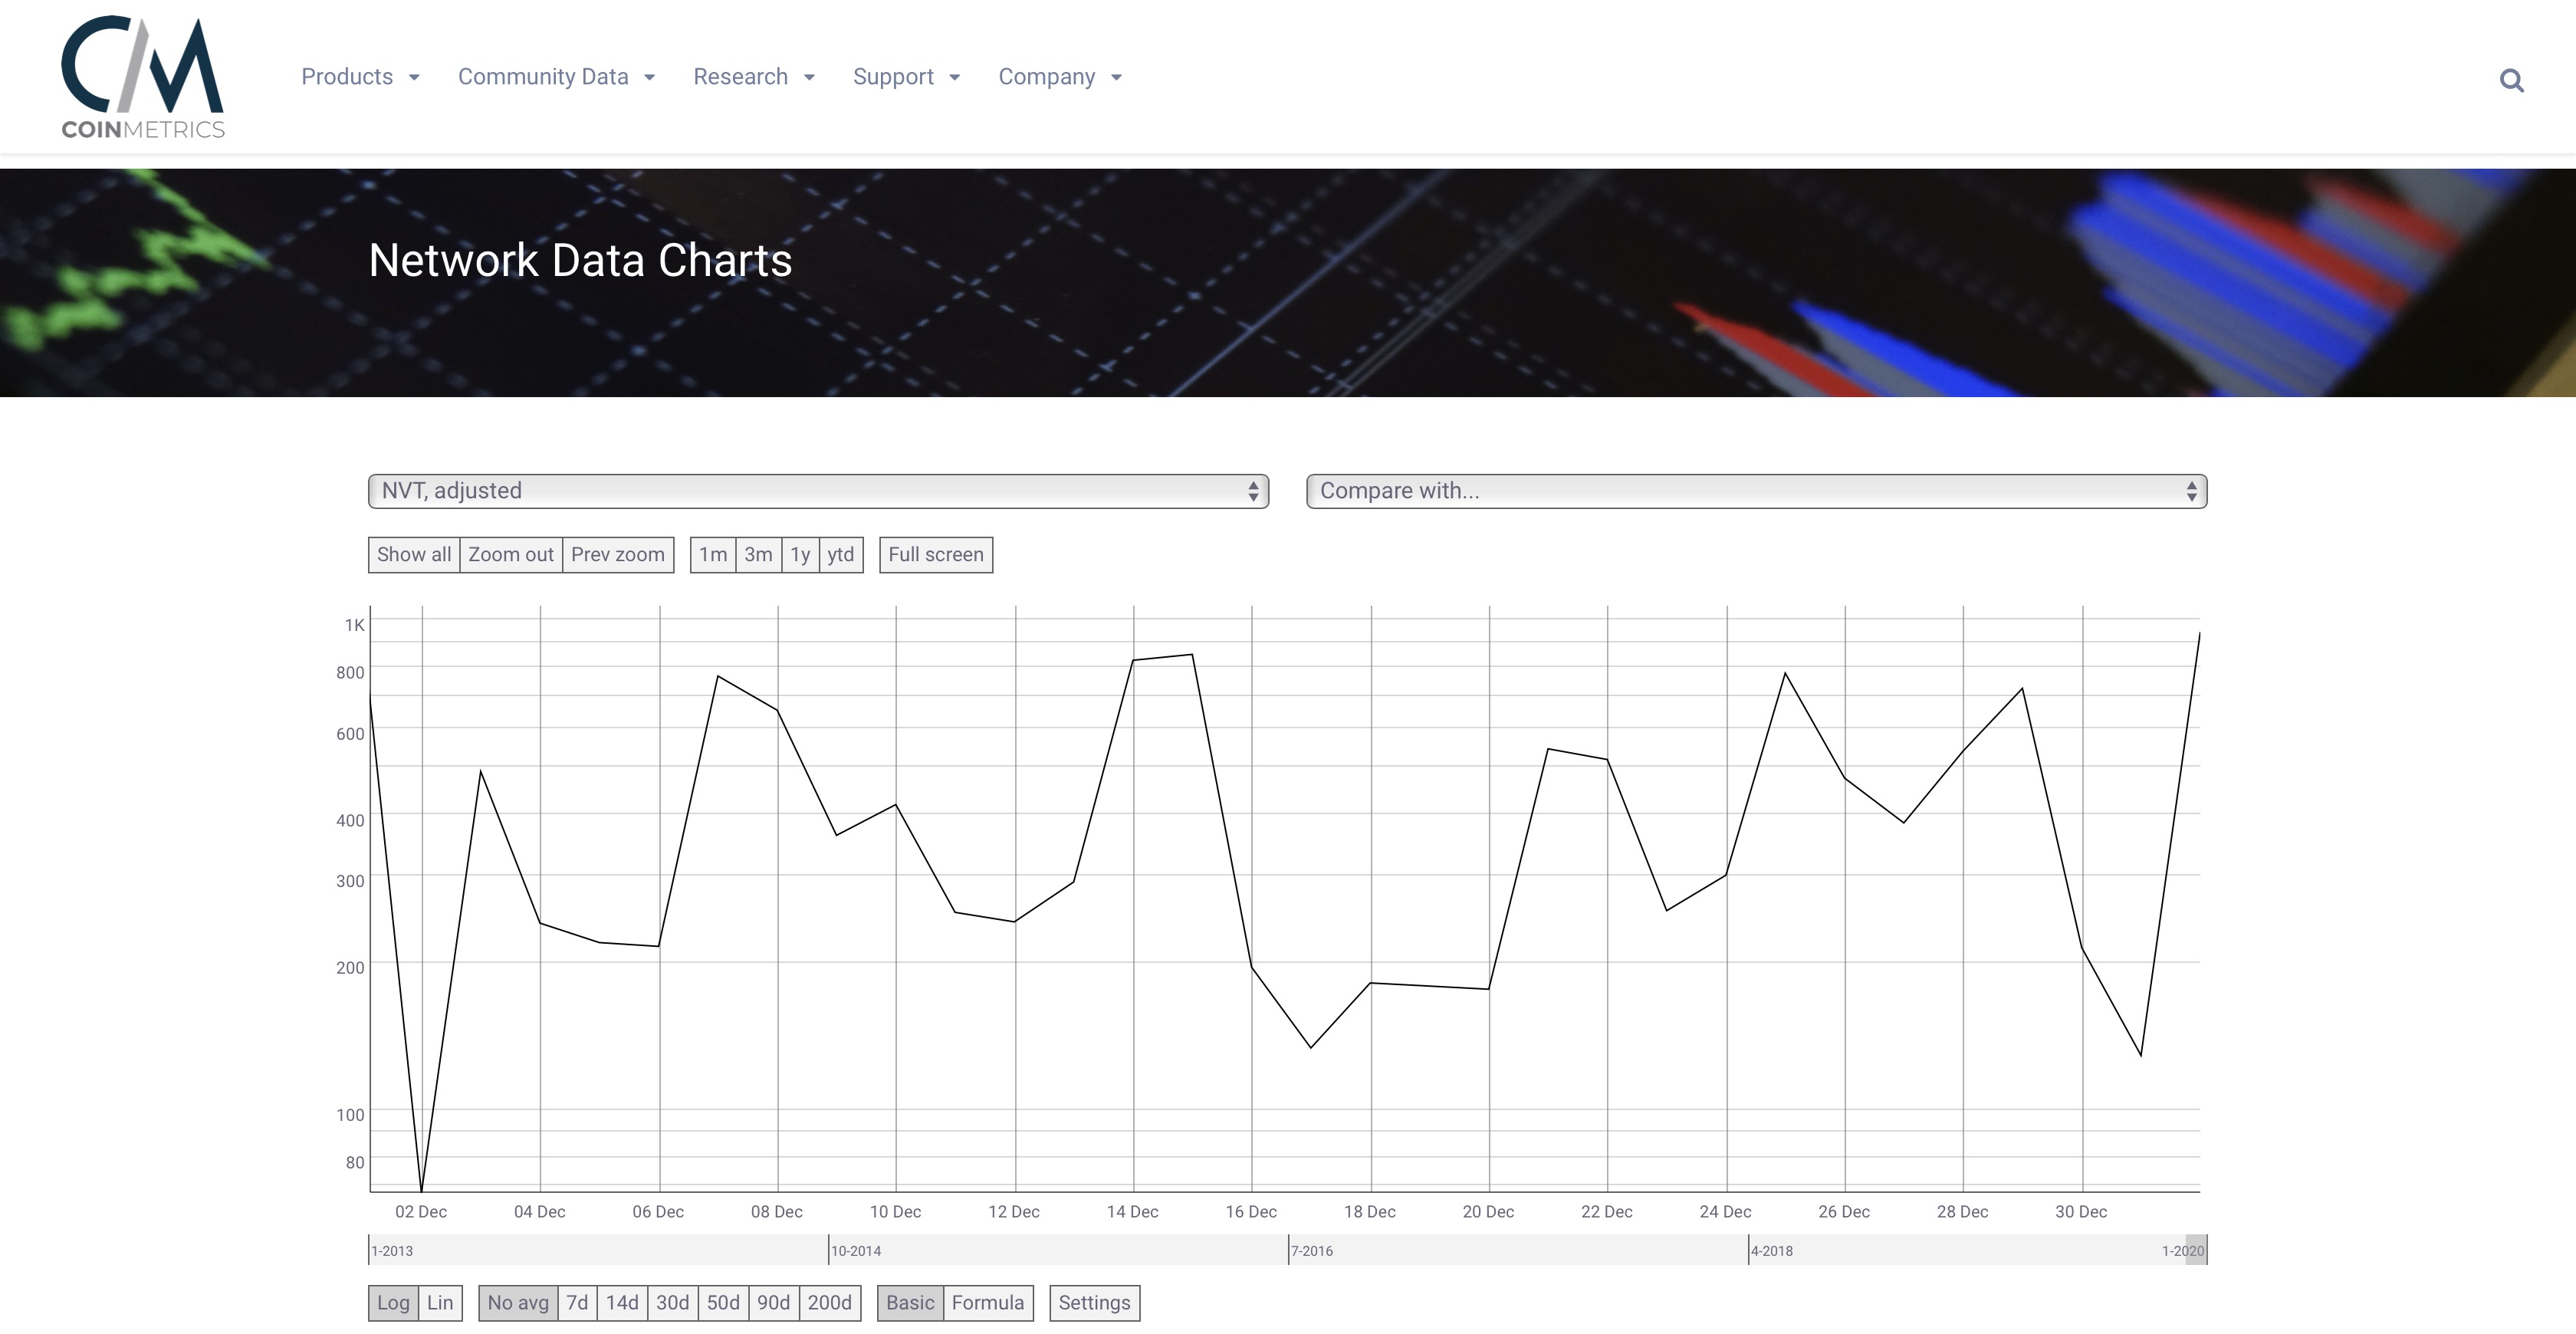
Network Value to Transactions Ratio

Source: CoinMetrics
According to CoinMetrics, the Network Value to Transactions (NVT) ratio which was devised and popularized by Willy Woo and Chris Burniske measures “the dollar value of crypto-asset transaction activity relative to network value.” Here, a ‘low’ market to transaction value denotes “an asset which is more cheaply valued per unit of on-chain transaction volume.”
According to Willy Woo himself, this metric is higher either when the network is in “high growth and investors are valuing it as a high return investment,” or when “the price is in an unsustainable bubble.” As of 1 January, the XRP NVT metric was 7.3x higher than what it was on 31 December, indicating that the coin could be valued more per unit of on-chain transaction, which could be interpreted as a buy signal.
Conclusion
If XRP manages to push above the 50-MA on the 4-hour chart, it is likely the coin will continue to push upwards, breaking out upward from $0.20 to at least $0.209 in the next day or so. A break downward would see XRP dropping to $0.182 over the same time frame. Though XRP’s long-term prospects are arguably not that great, a short-term move up in price doesn’t seem unreasonable at this point in time.


