
Despite Bitcoin’s share of the market holding steady over the last few weeks, the world’s largest cryptocurrency’s price movement, owing to high correlation stats, continues to exert a lot of influence on the movement of other cryptos. The same was highlighted by the price performances of Tezos and STEEM. However, the same wasn’t evident when Crypto.com Coin’s price charts were observed, with CRO continuing to plunge on the charts.
Tezos [XTZ]
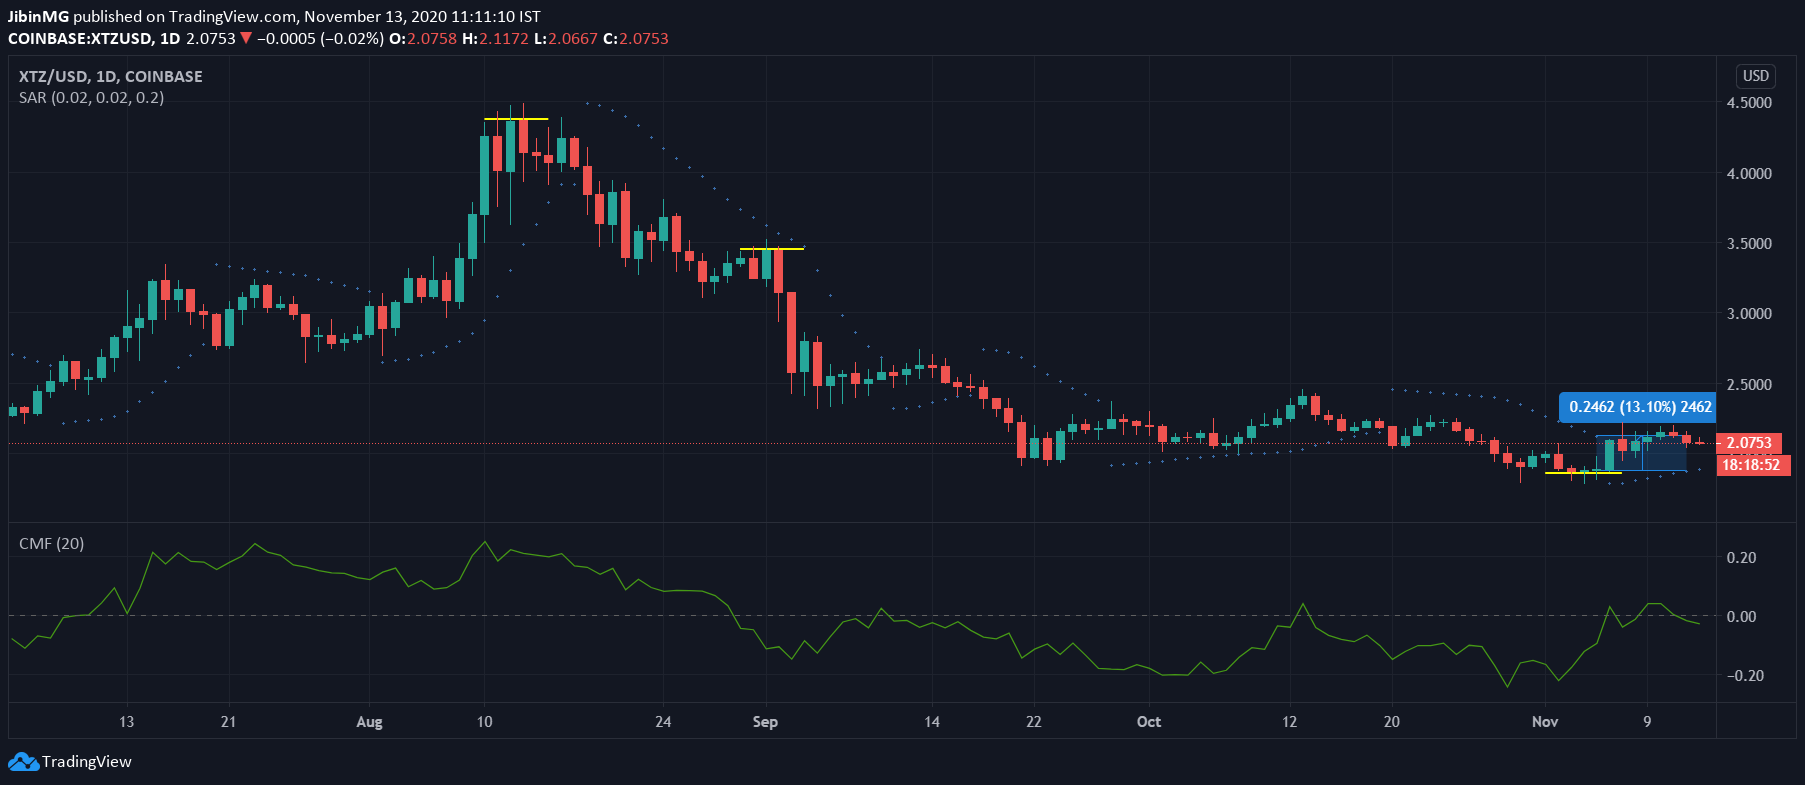
Source: XTZ/USD on TradingView
Tezos, the market’s 18th-ranked crypto, has fallen down the crypto-ladder over the past few weeks, with XTZ noted to have been positioned as high as 11th just a few months ago. The cryptocurrency’s fall down the crypto-ladder came on the back of its poor price performance in the months of September and October, with XTZ failing to recover from the market-wide depreciation in late-August.
Owing to Bitcoin’s performance, however, XTZ climbed on the charts, with the crypto hiking by over 13% in just a week. It should be noted, however, that XTZ continued to trade within a tight trading channel.
While the dotted markers of the Parabolic SAR underlined the bullish nature of XTZ’s recent market movement, the Chaikin Money Flow had dipped under zero, a sign of capital outflows being marginally greater than the capital inflows.
The cryptocurrency was in the news recently after Sygnum Bank announced its latest offering – Tezos staking.
STEEM
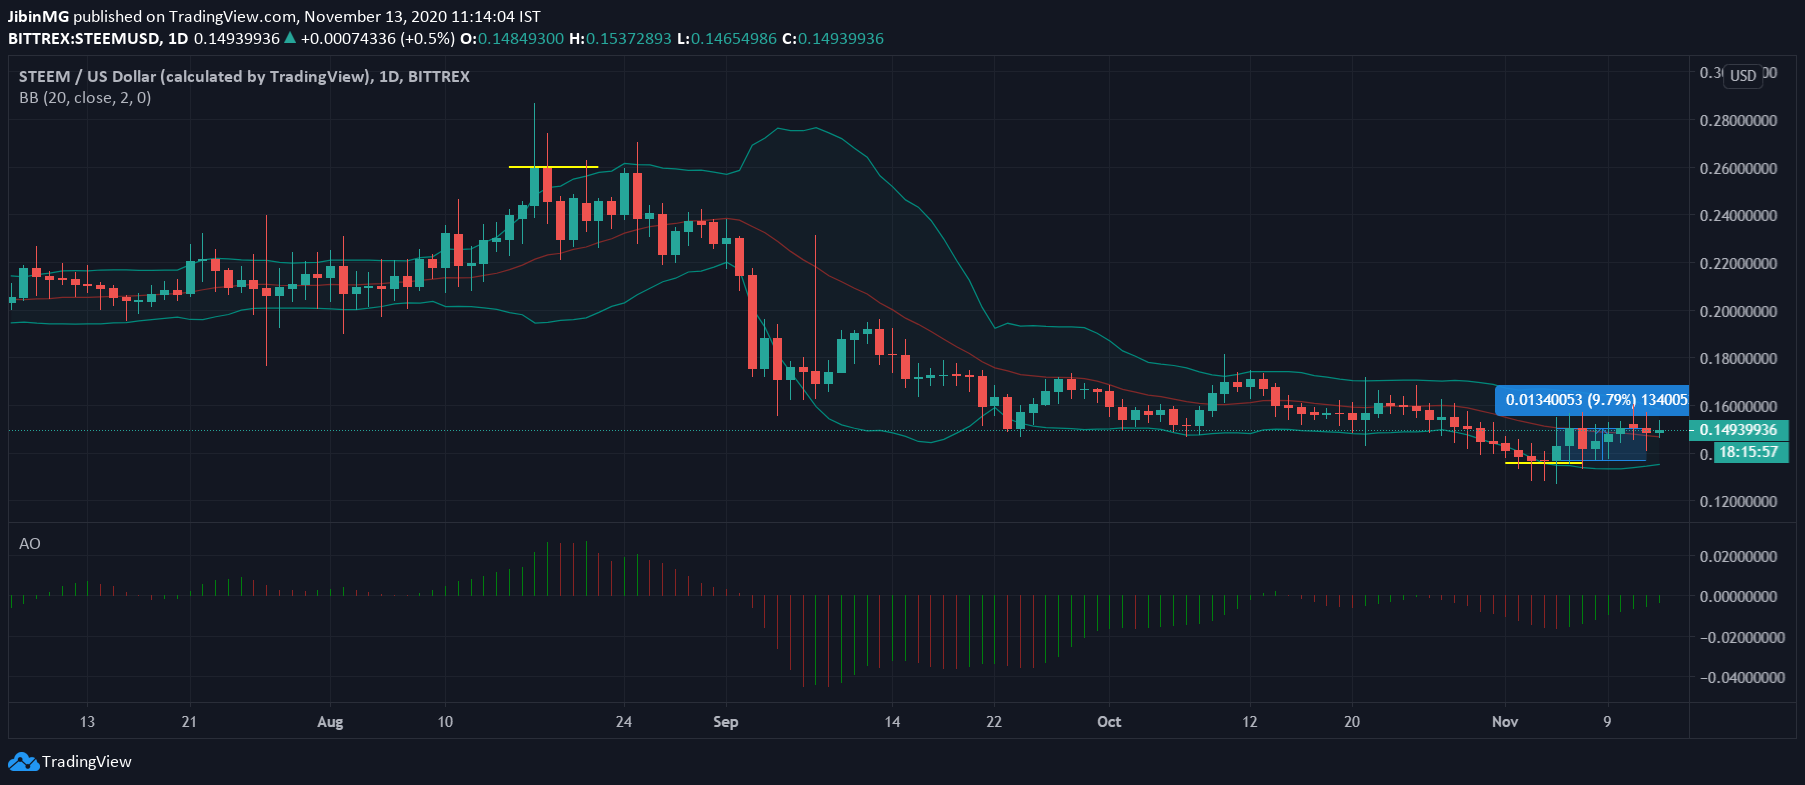
Source: STEEM/USD on TradingView
While Tezos may have fallen by a few spots on the crypto-ladder, STEEM’s own fall on CoinMarketCap’s charts has been far more dramatic. In fact, once a token in the market’s top-50, STEEM had fallen out of the top-100 by the time of writing.
However, like Tezos, STEEM did see some positive price movement on the back of Bitcoin’s performance. In fact, STEEM climbed by almost 10% on the charts after Bitcoin climbed to re-test the $16,000-price level again.
As far as the indicators are concerned, the width of the Bollinger Bands remained uniform, an indication of some degree of volatility in the near-term. Further, the Awesome Oscillator highlighted some negative momentum in the market.
Crypto.com Coin [CRO]
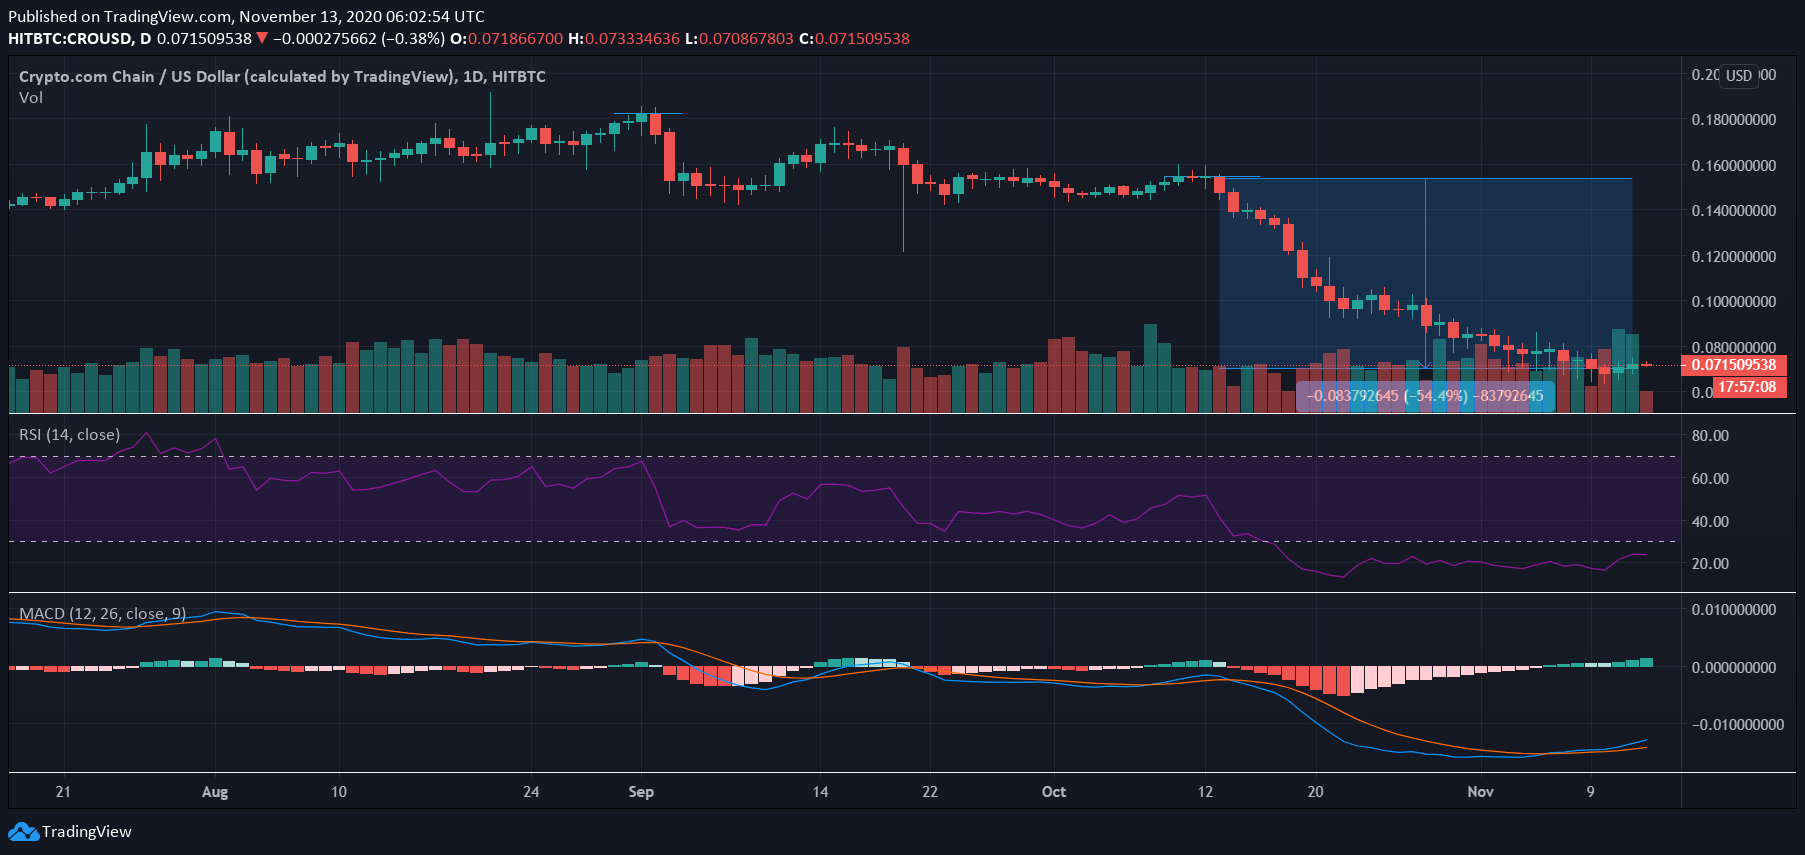
Source: CRO/USD on TradingView
Like the other two cryptocurrencies in this article, Crypto.com Coin too has fallen down the crypto-ladder. Once in the top-10, CRO, at press time, was positioned 19th on CoinMarketCap’s rankings. It should be noted, however, that CRO’s fall on the price charts has been far more dramatic, with the exchange token down by over 50% in the last 30 days alone.
Despite the latest market surge pushing the crypto’s price and trading volume over the last few days, CRO continued to trade at a level that was far off from the levels it was trading at in the month of August.
The bearishness in the market was underlined by the Relative Strength Index as the RSI was hovering in the oversold zone. However, the latest surge did allow the MACD line to note a bullish crossover on the charts.