Stellar Lumens, Ontology, FTX Token Price Analysis: 08 November

The Crypto Fear and Greed Index noted a figure of 82, compared to the previous day’s 88. Bullish sentiment was strong for Bitcoin and Ethereum, and by extension, many alts in the market managed to register gains as well.
Stellar Lumens was one of the many crypto-assets that appeared to have initiated an uptrend, while Ontology has not shrugged off its downtrend. FTX Token was short-term bullish, but had a bearish bias on a longer-term outlook.
Stellar Lumens [XLM]

Source: XLM/USD on TradingView
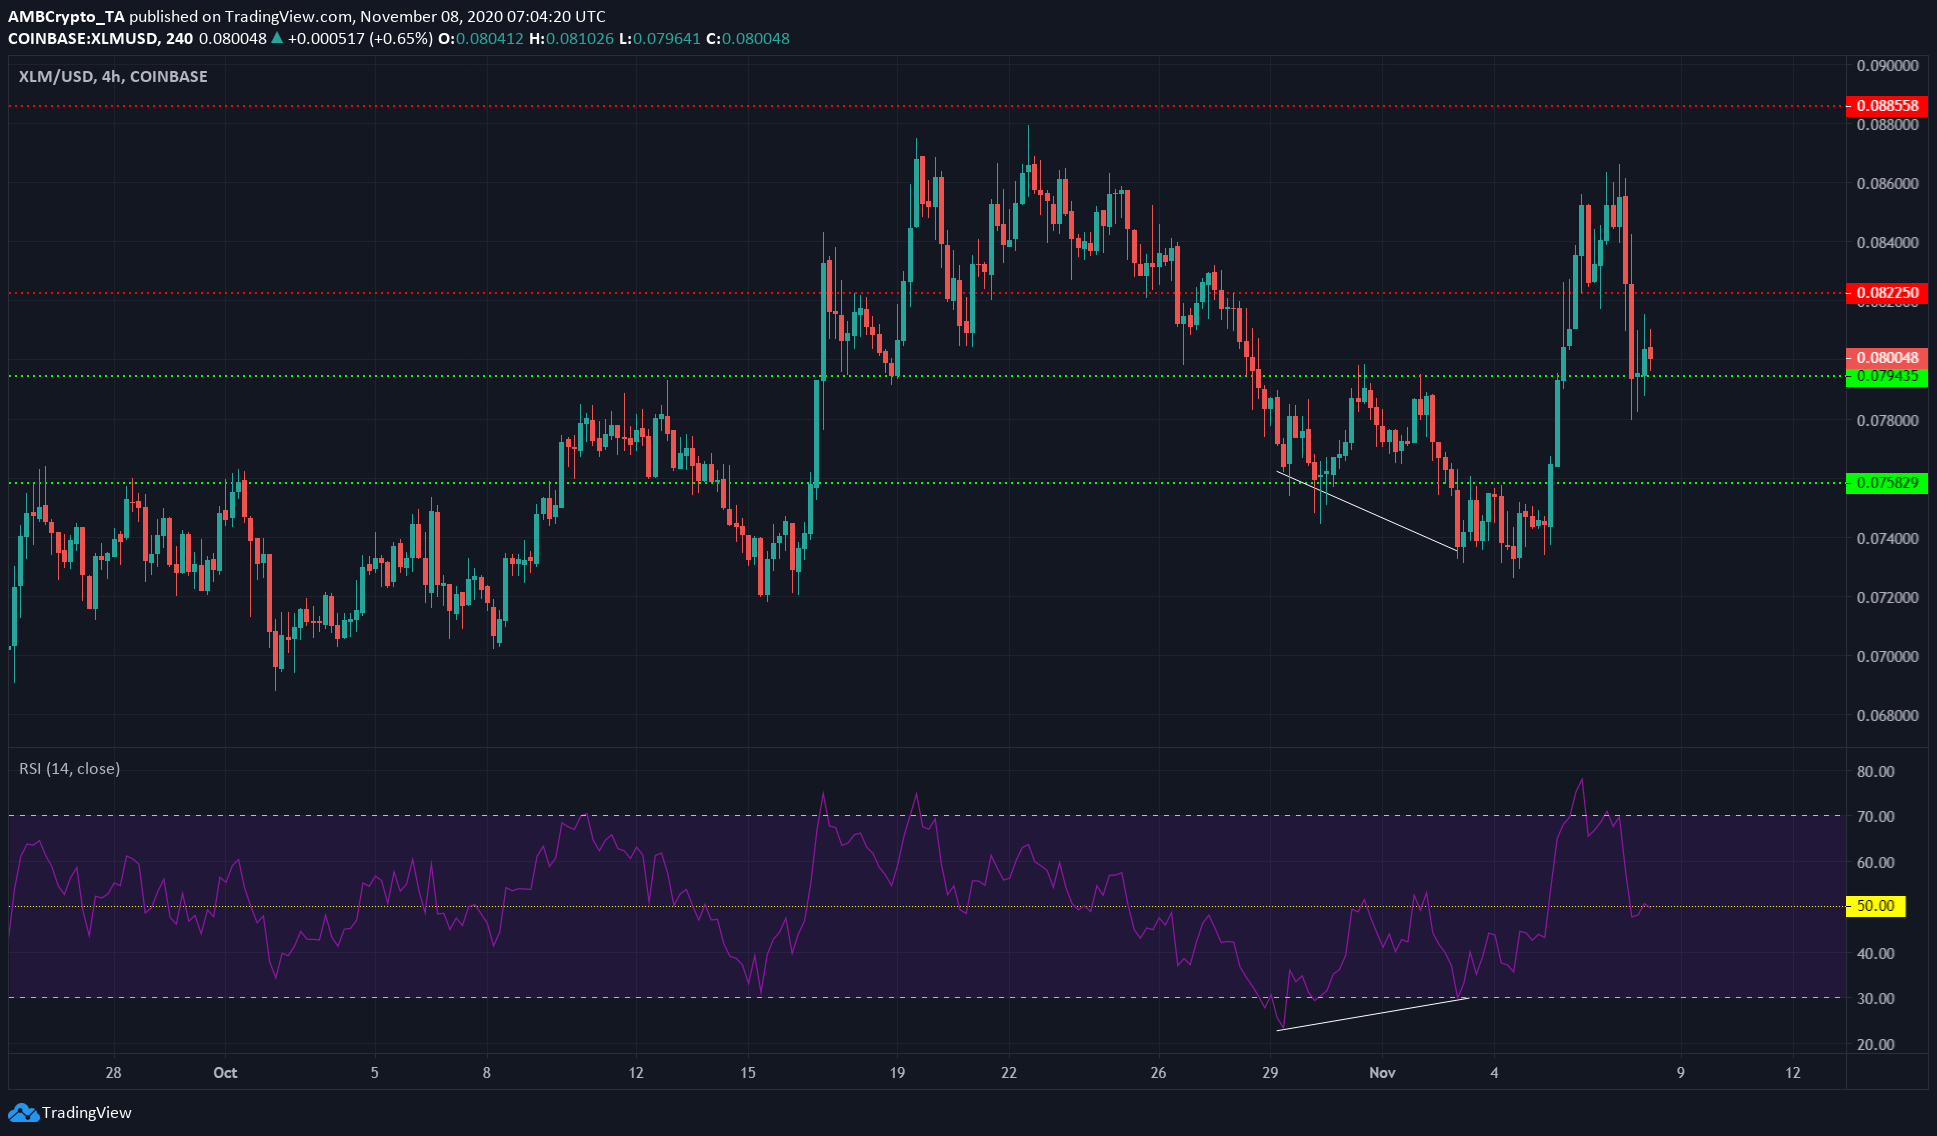
Stellar Lumens exhibited a bullish divergence as the price made a lower low while the momentum indicator (RSI) made a higher low and shifted. This divergence, combined with Ethereum’s surge, gave most of the altcoin market a new lease of life.
At the time of writing, the RSI stayed above 50 while XLM saw a pullback to the support at $0.0794. The momentum was bullish in the short-term for the crypto-asset.
The next levels of resistance lay at $0.082 and $0.088.
Ontology [ONT]

Source: ONT/USDT on TradingView
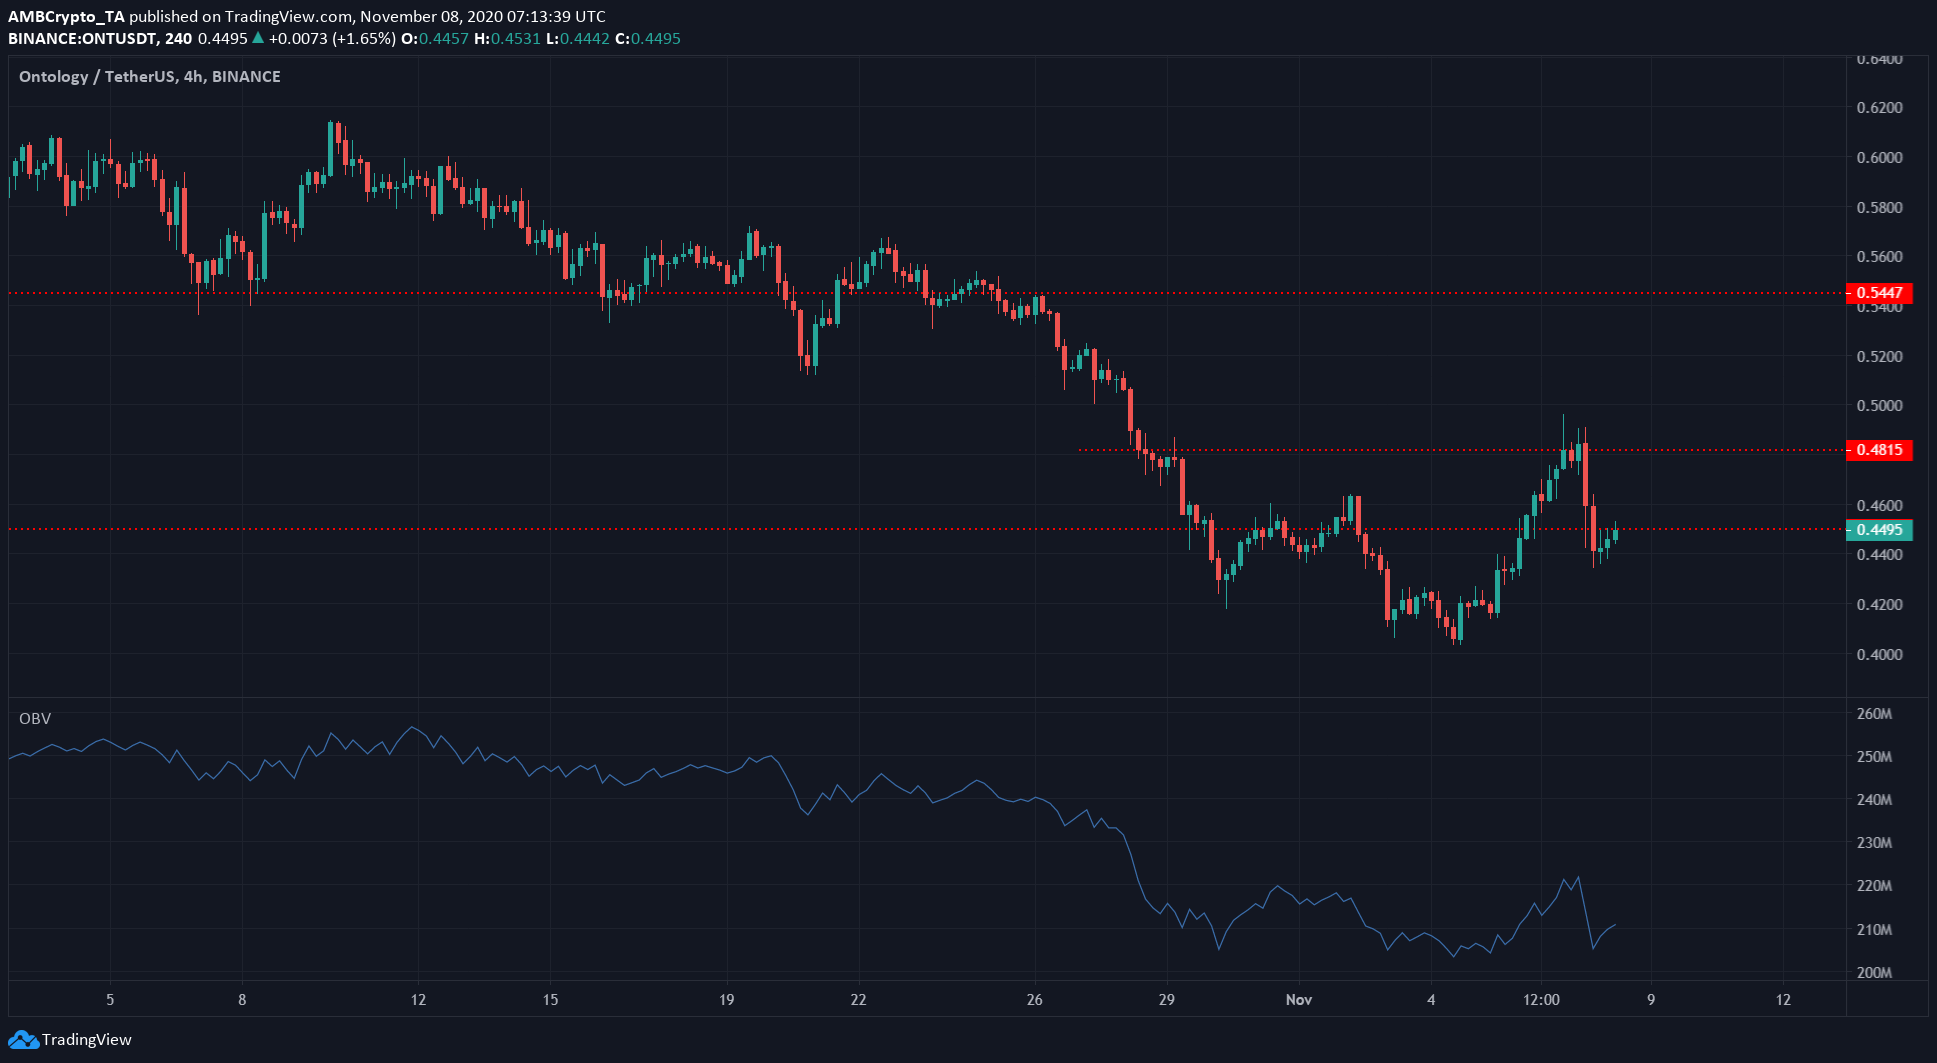
ONT failed to climb to the all-important level in the past two months at $0.54. ONT’s brief spike from $0.4 to near-$0.48 was a respectable 21%, but nowhere close to a trend reversal.
The bears were also successful in pushing the price under the support level at $0.44, although bulls could yet defend that region and push the price above the same.
The OBV painted a bleak picture alongside the price chart, as both continued to post lower highs to highlight ONT’s longer-term downtrend.
FTX Token [FTT]

Source: FTT/USD on TradingView
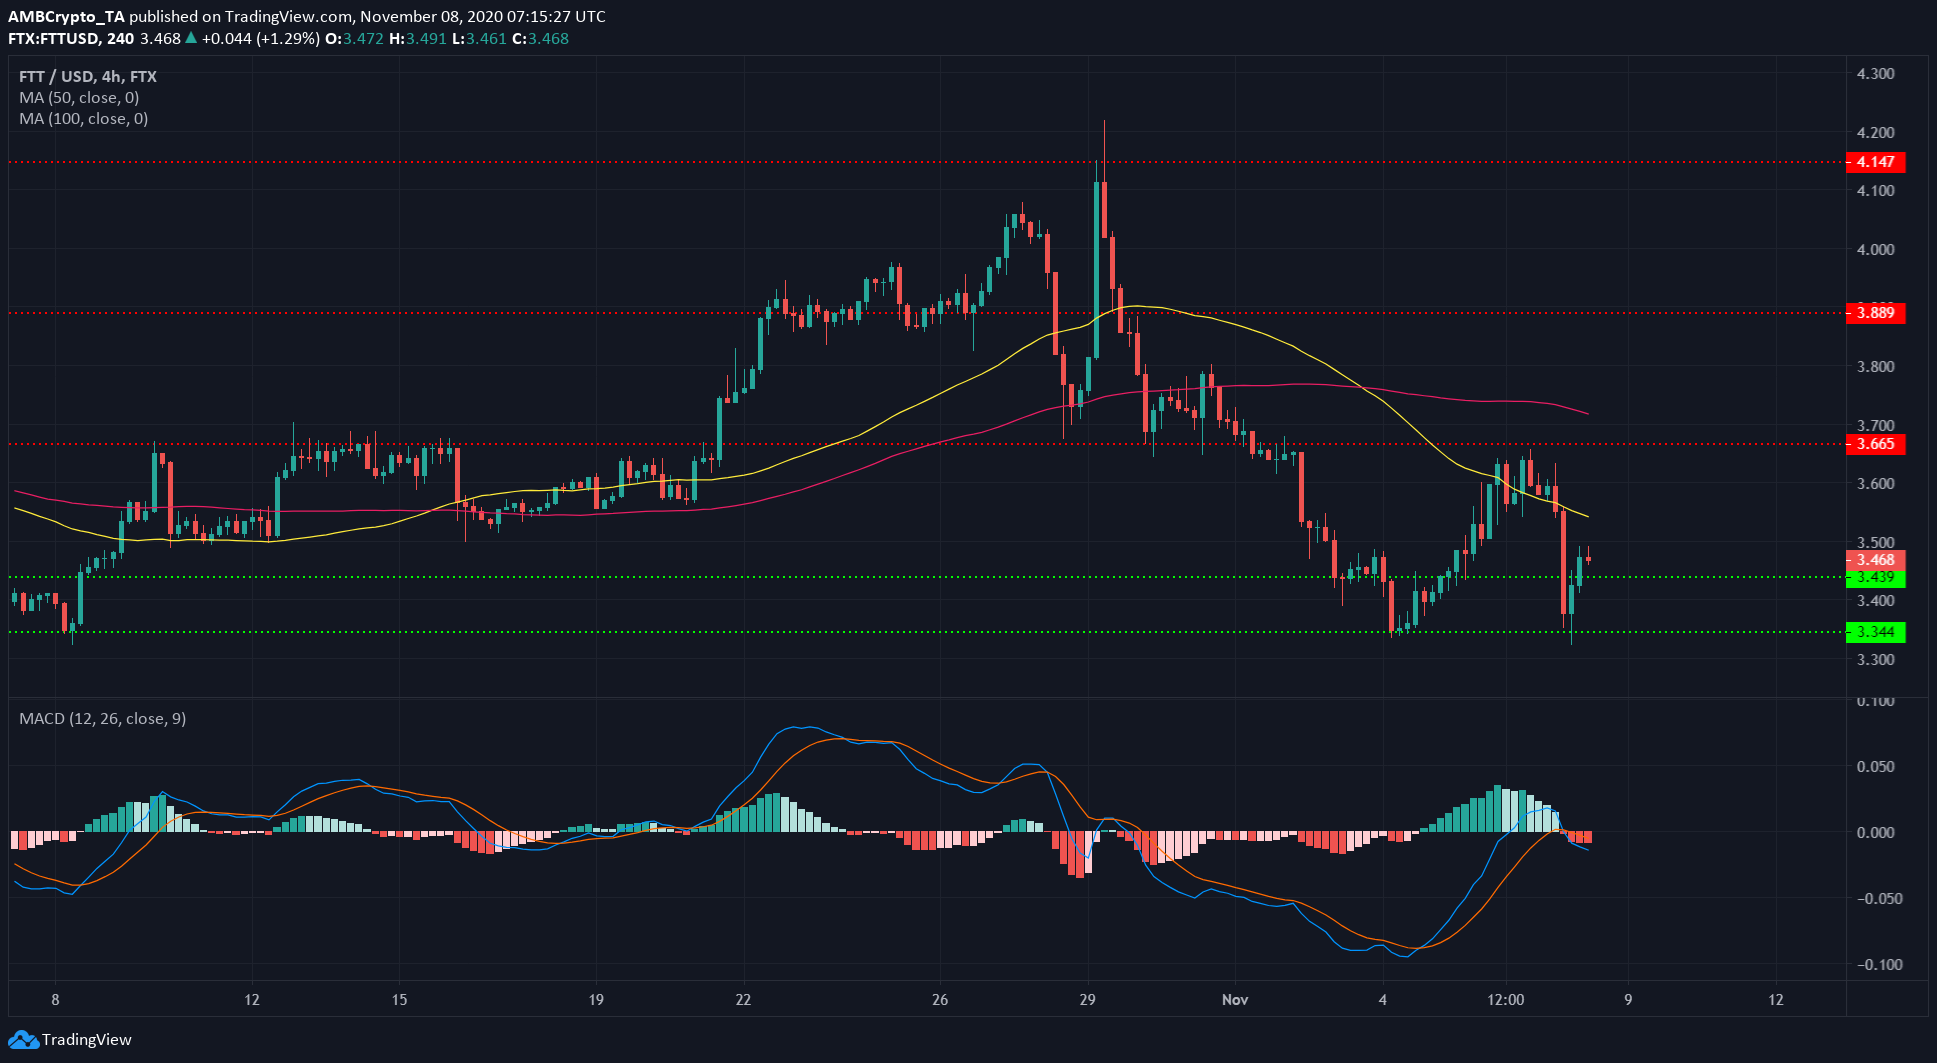
FTT bounced strongly off its support at $3.34, but the market bears crashed the bulls’ party near the resistance at $3.66 and almost undid all the gains FTT recorded.
$3.34 was defended, and the next level was also breached but the market was still a bear market in the short to medium term, as highlighted by the moving averages.
The 50 SMA (yellow) was moving beneath the 100 SMA (pink) to denote FTT’s recent losses from a local high of $4.1. Both moving averages can also act as a resistance to the price in the coming days.
In related news, FTX Founder Sam Bankman-Fried donated $5.2 million to the Biden campaign.


