
- FTT has seen a double-digit rally in the past few days.
- Whales have increasingly accumulated the altcoin.
Changpeng Zhao’s resignation as CEO of Binance and the attendant decline in BNB Coin [BNB] accumulation has resulted in an uptick in demand for FTT, the native token of bankrupt exchange FTX, on-chain data has shown.
Trading at $4.50 at press time, FTT’s price has rallied by 50% since 21st November when Zhao announced his exit from cryptocurrency exchange giant Binance.
Impacted by October’s general market rally, FTT has embarked on an uptrend in the last month, rising by over 300% in the last 30 days. FTT whales have increasingly accumulated the altcoin during this period to benefit from the unexpected price hike.
Data from Santiment showed further that in the last three days, the daily count of FTT whales that hold between 100 and 100,000 tokens has risen by almost 10%. At press time, this figure stood at 4010.
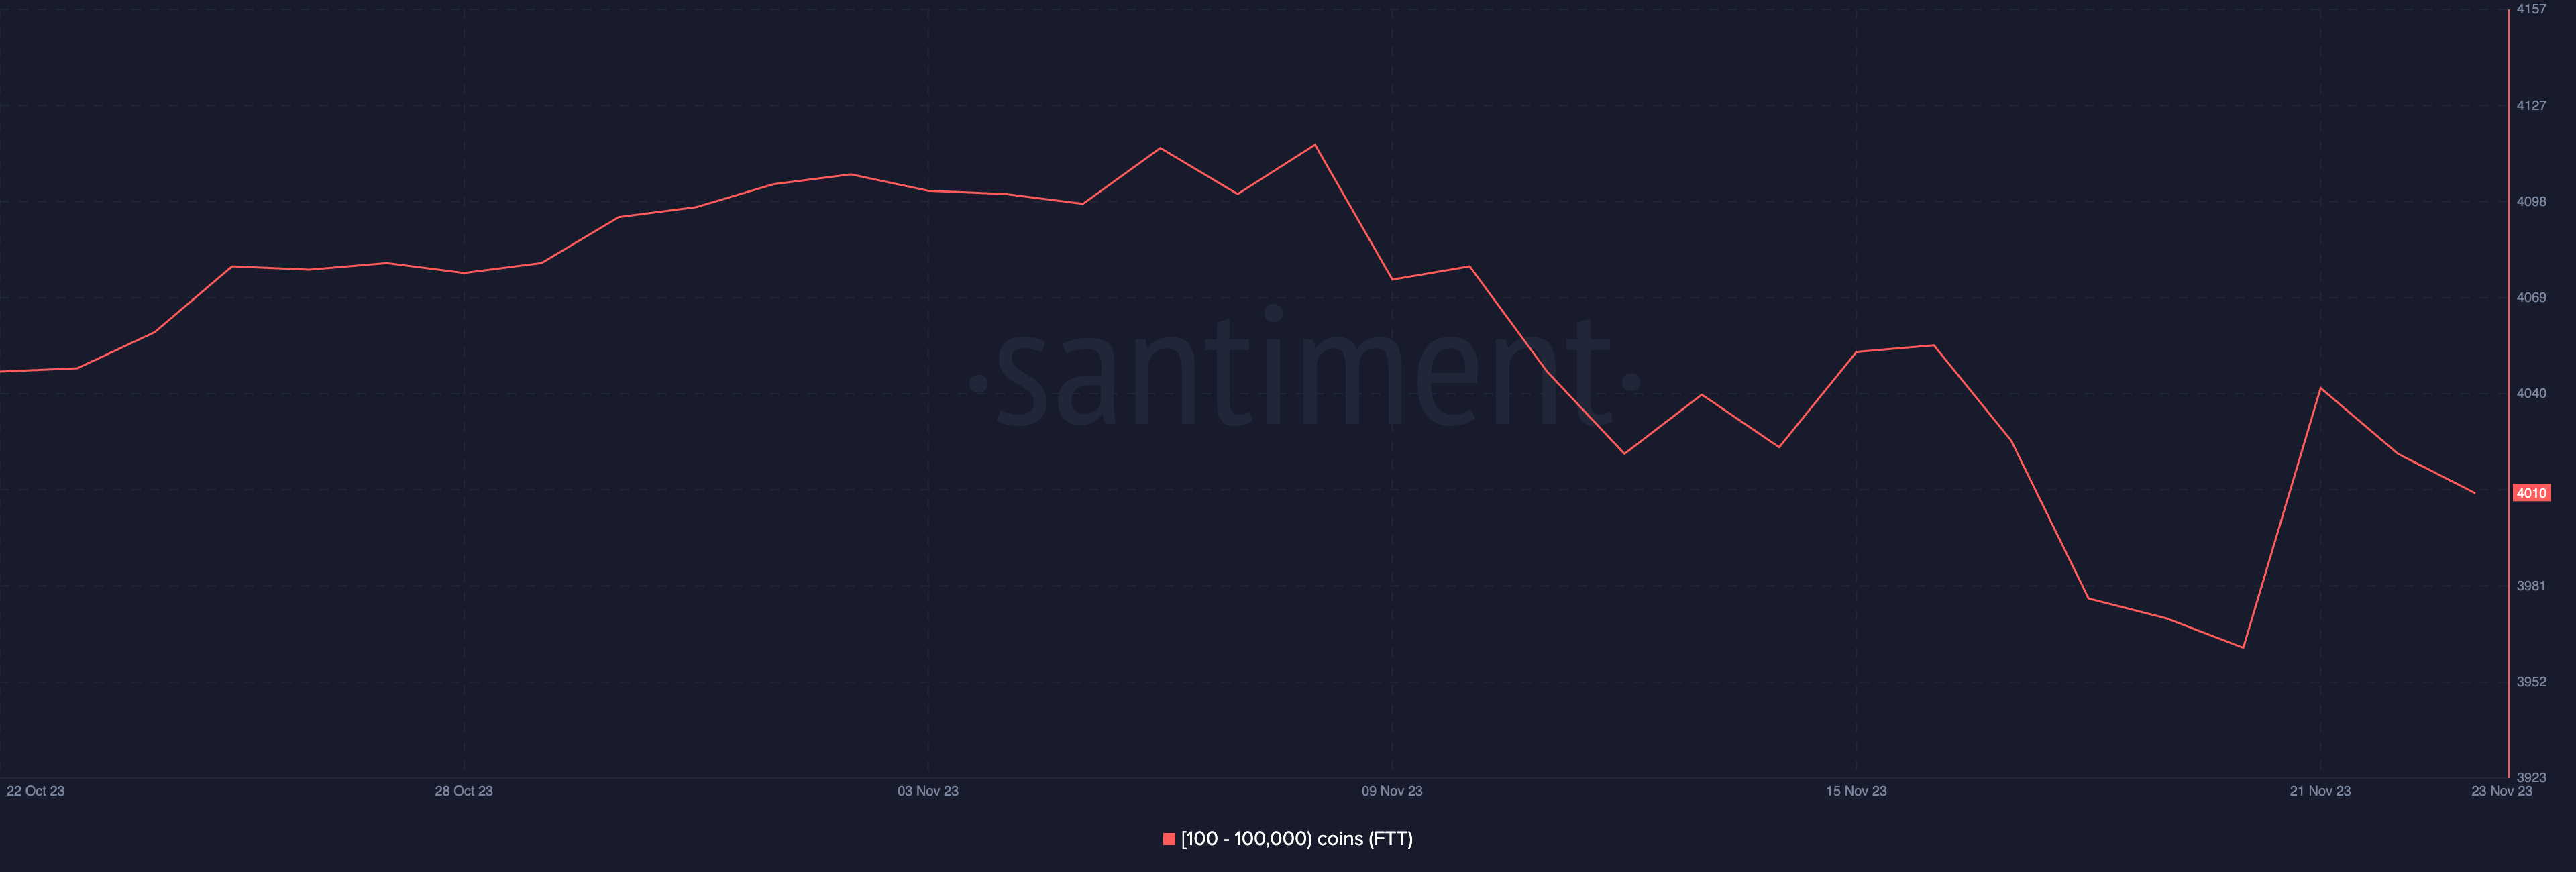
Source: Santiment
Likewise, the top ten largest FTT whales have accumulated a cumulative value of 2.91 million tokens worth around $13 million since 3rd November. This has resulted in a 255% surge in the relative value of FTT to leading coin Bitcoin [BTC] since then.

Source: Santiment
Things appear good, but…
AMBCrypto’s assessment of FTT’s On-balance volume indicator (OBV) on a 24-hour chart confirmed the accumulation trend in the past few weeks.
At 92.36 million at press time, FTT’s OBV has increased by 144% since the 8th of November.
When an asset’s OBV witnesses this kind of significant rally, it means that there is growing buying pressure behind the asset, as more buyers are willing to purchase it at the current price.
Further, FTT’s key momentum indicators positioned above their respective center lines showed that spot market participants continue to favor buying over selling.
As of this writing, FTT’s Relative Strength Index (RSI) was 69.57, while its Money Flow Index (MFI) was 56.30. These values showed that FTT accumulation continues to outpace distribution.
However, despite the 300% price surge in the last month, FTT’s Chaikin Money Flow (CMF) persists in its divergence from FTT’s price.
The CMF indicator tracks the volume and direction of money flow in and out of an asset over a specified period.
Read FTX Token’s [FTT] Price Prediction 2023-24
A divergence occurs when an asset’s price and its CMF trend in opposite directions. This divergence is deemed bearish and suggests an imminent correction when an asset’s price climbs while its CMF value declines.
As there are no strong market fundamentals that support FTT’s current rally, the price/CMF divergence could be due to short-term speculation, large sell orders, insufficient buying volume, or market manipulation.
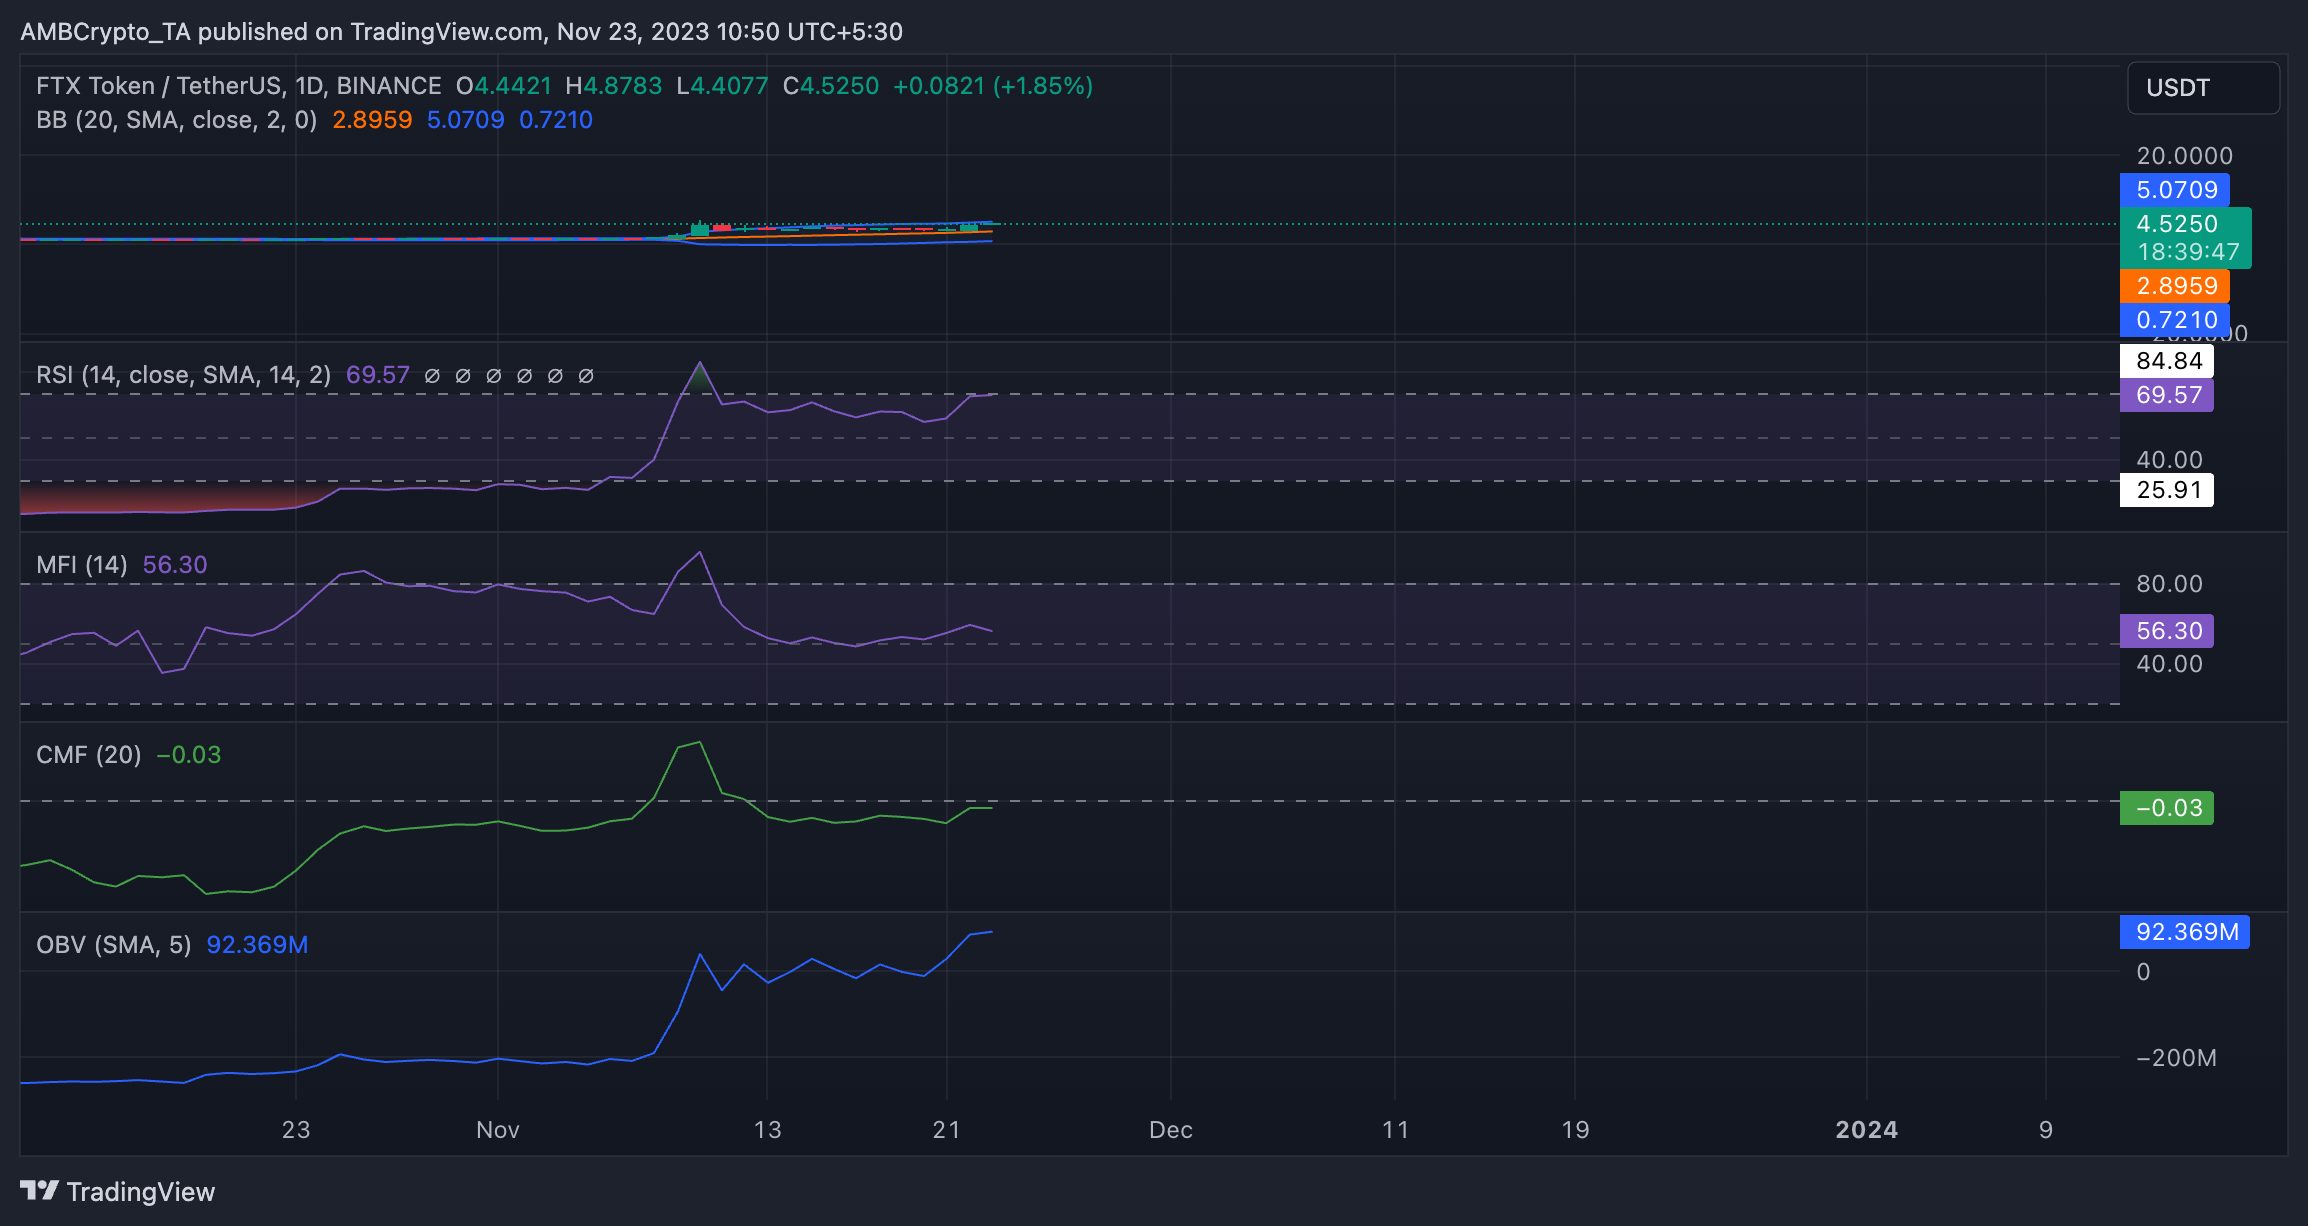
Source: FTT/USDT on TradingView