
At press time, Ethereum had rocketed from $350 to $374 within 24 hours, in a move that boded well for the rest of the altcoin market. In fact, the general bearish sentiment around altcoins appeared to have swung to welcome a more bullish outlook. Stellar Lumens and NEM showed strong signs of bullishness, while DigiByte might see a minor pullback on the charts.
Stellar Lumens [XLM]
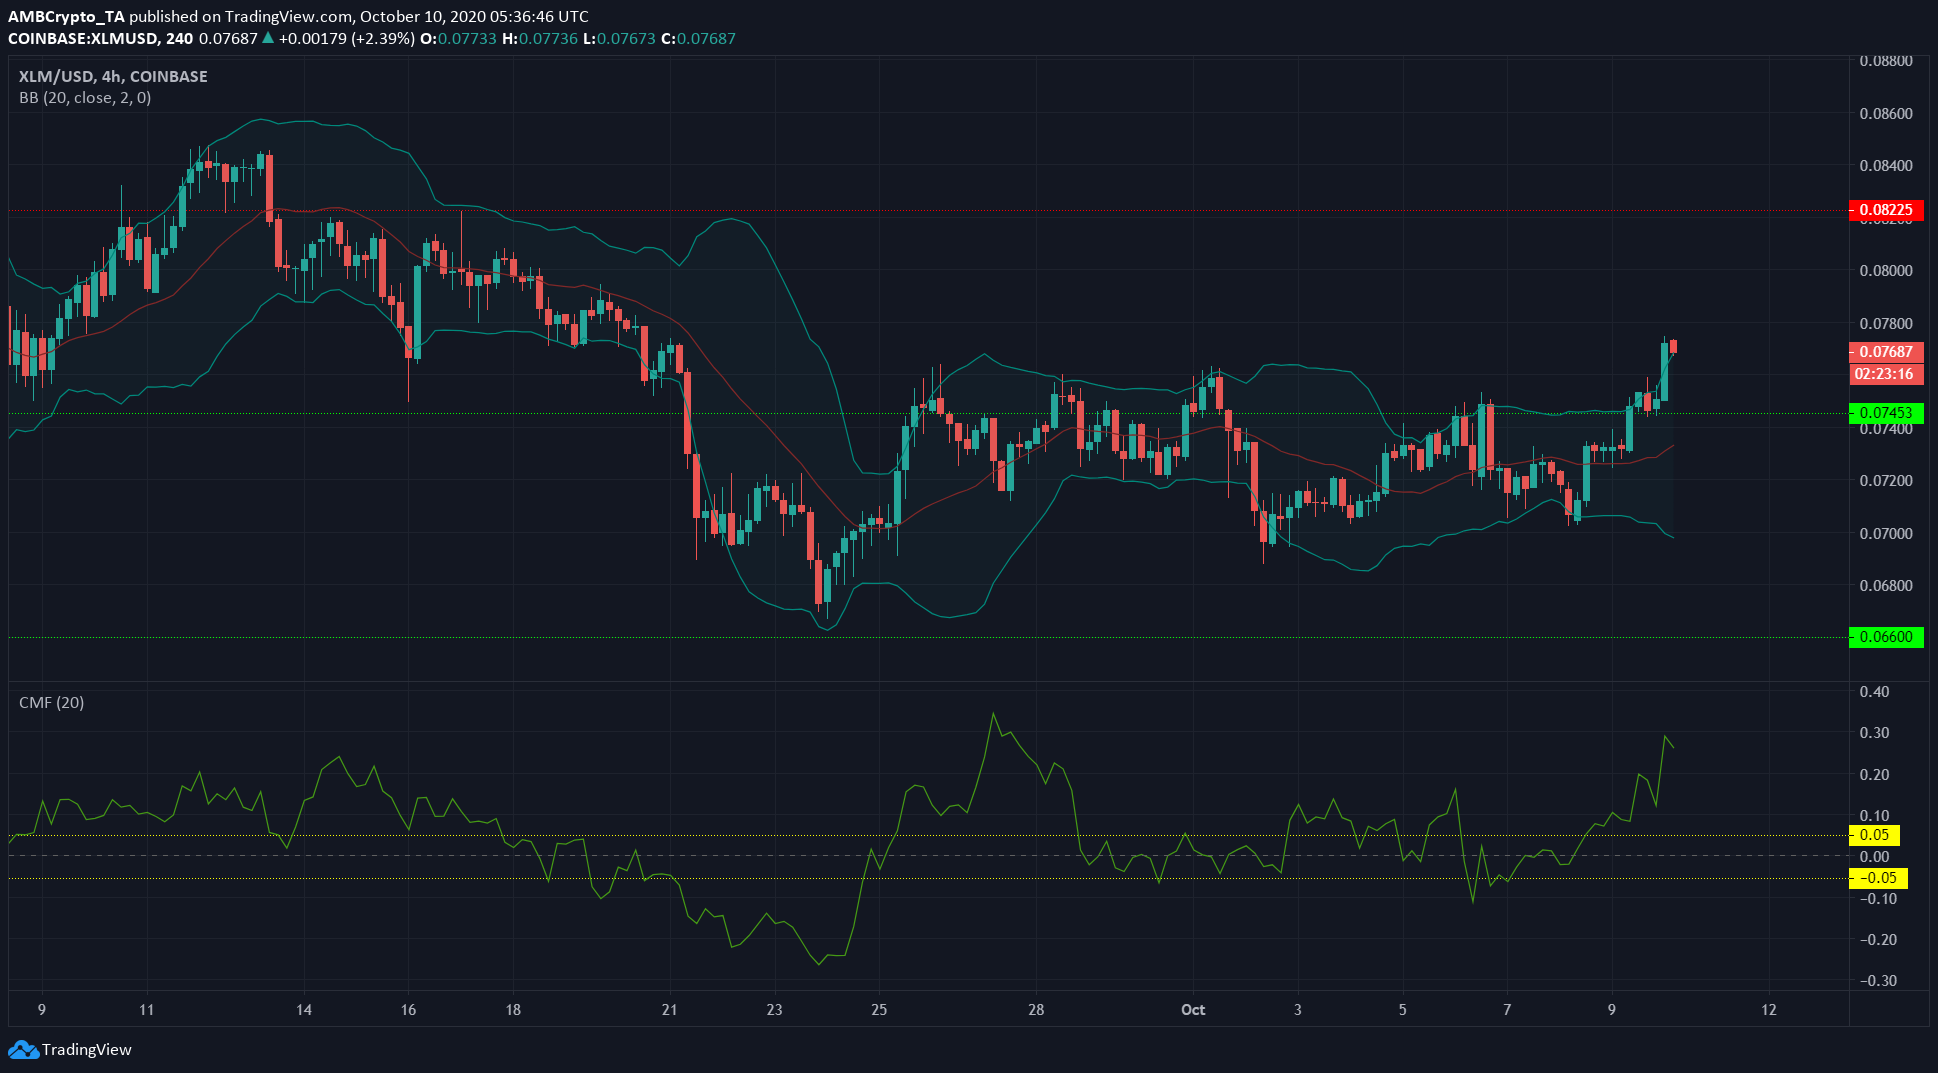
Source: XLM/USD on TradingView
Stellar Lumens’ market has been dominated by buyers over the past couple of weeks. The CMF was either in the neutral zone or in positive territory, underlining an equilibrium between buyers and sellers, alongside periods of strong capital inflows into the market.
Further, the Bollinger Bands also appeared relatively tight around XLM’s price recently. This, however, was changing at press time as the mouth of the bands expanded to show more volatility, while the price moved towards the upper band.
This development indicated a breakout to the upside, past the resistance level at $0.07. It was likely that XLM would test the resistance level at $0.082 in the coming days.
NEM [XEM]
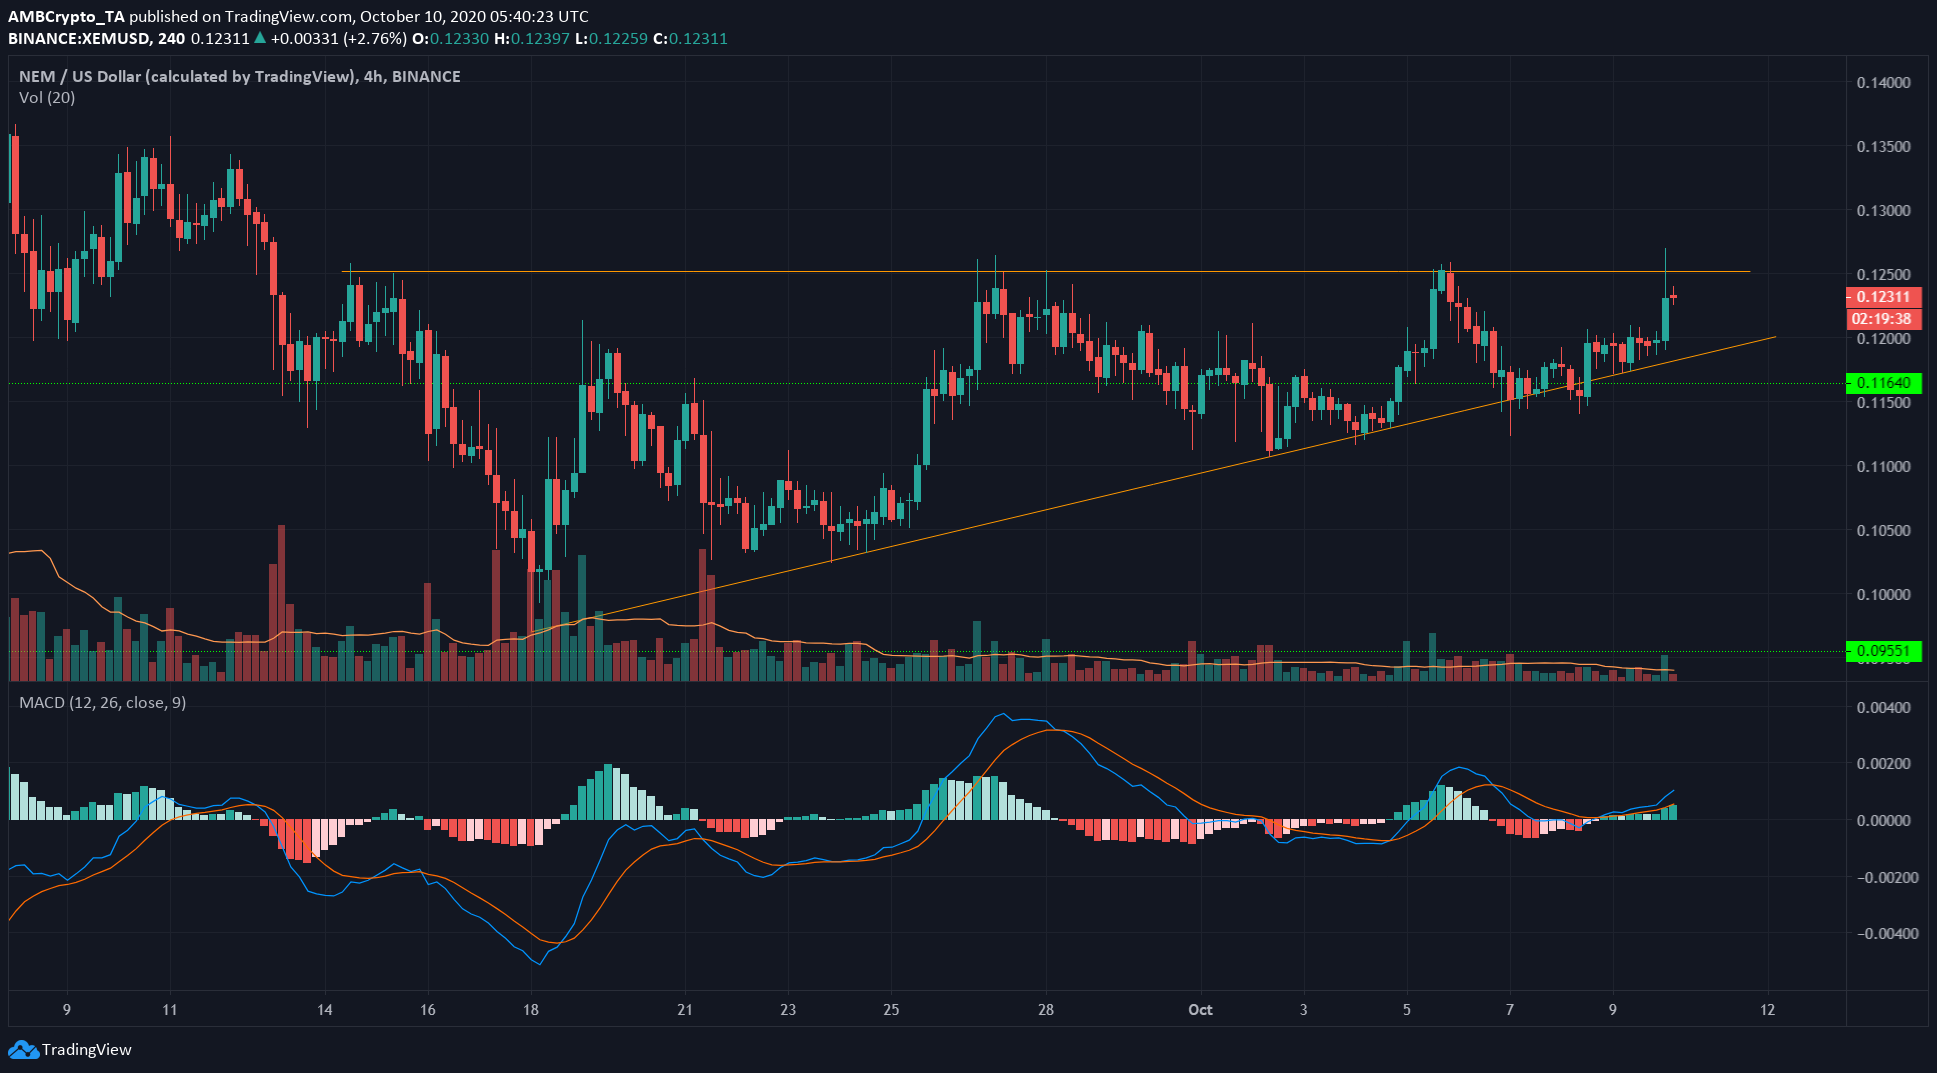
Source: XEM/USD on TradingView
XEM formed an ascending triangle (orange) on the 4-hour charts. This is generally a bullish pattern, with a projected target equal to the base of the triangle. In this case, that measured to be $0.028.
Hence, XEM, upon breaking to the upside of this pattern, can be expected to reach the next level of resistance at $0.151. The gradually falling trading volume of XEM, when within the pattern, also supported the notion of an ascending triangle formation.
The MACD formed a bullish crossover above zero, showing bullishness. However, a close beneath the rising trendline would invalidate the pattern.
DigiByte [DGB]
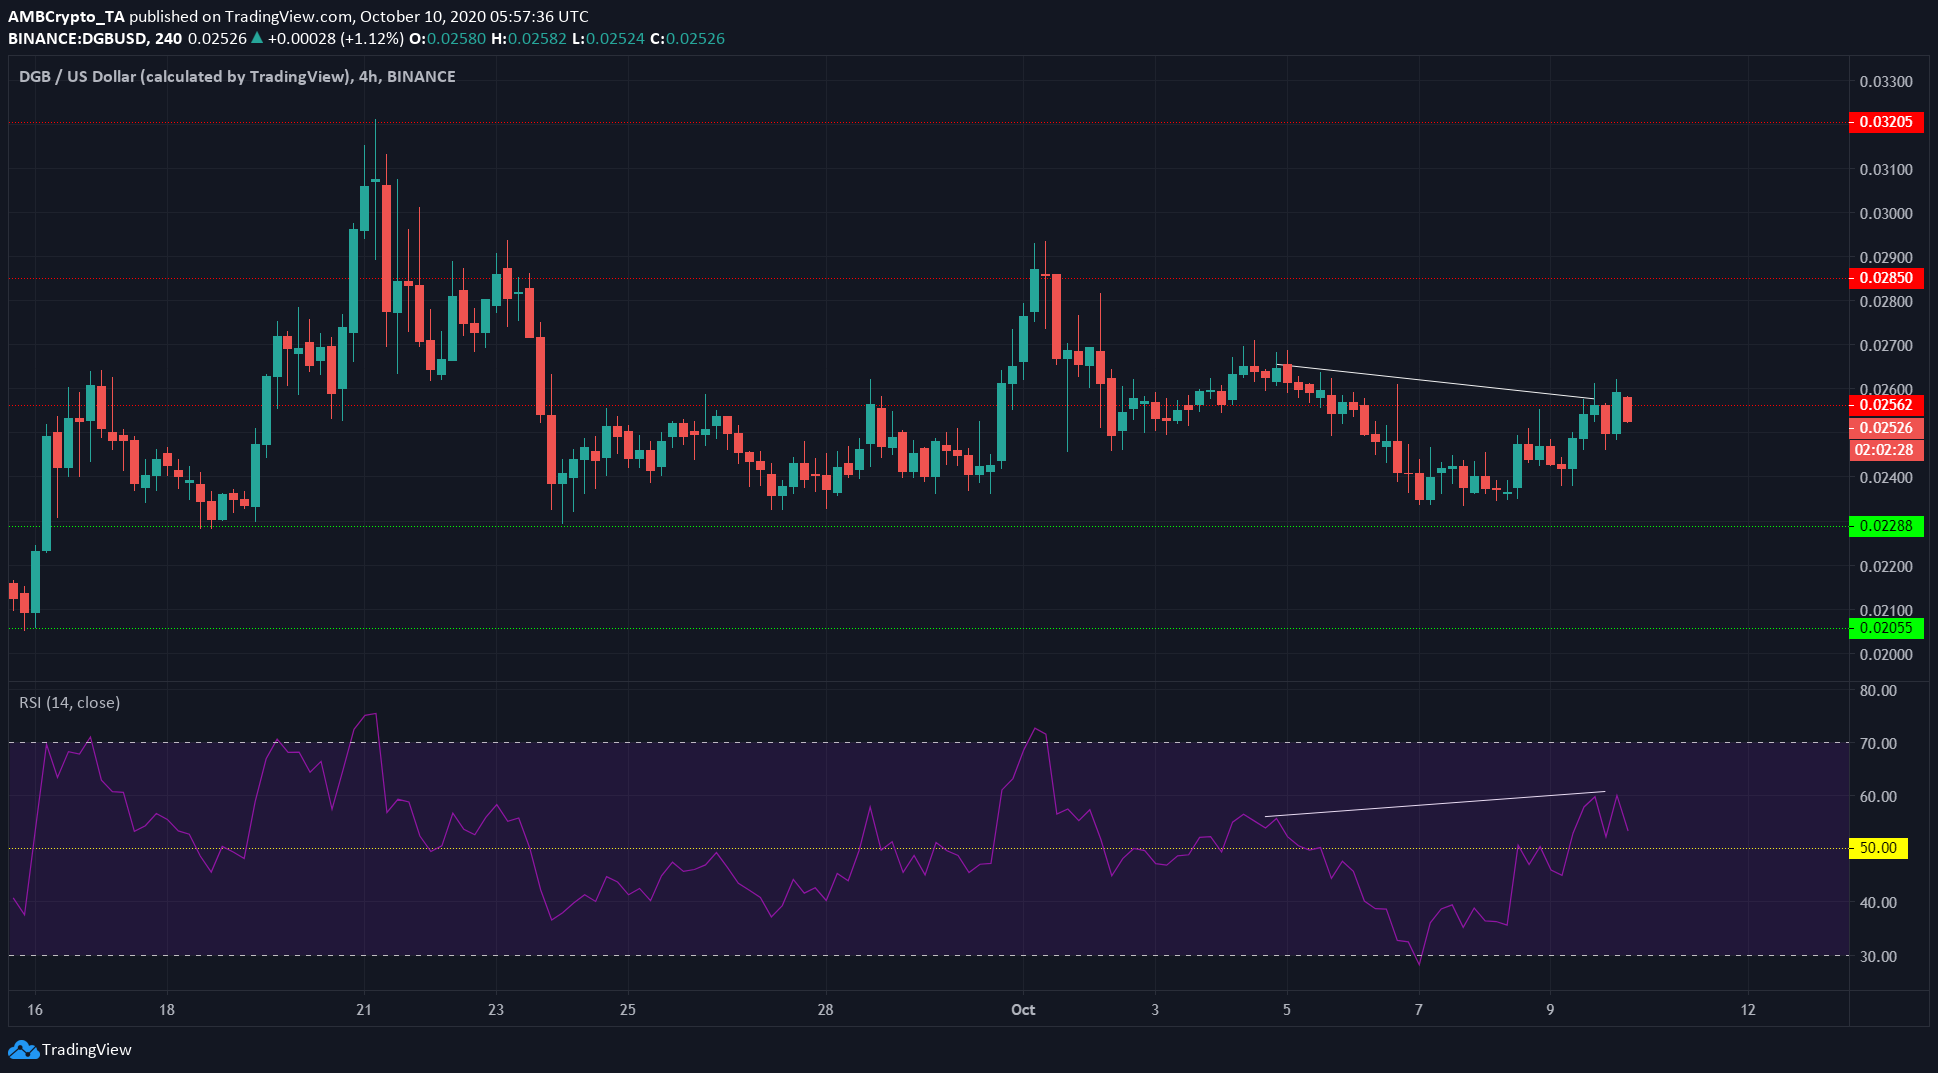
Source: DGB/USD on TradingView
DigiByte pictured a hidden bearish divergence on the charts. Highlighted in white, the price made lower highs while the momentum indicator (RSI) formed higher highs.
With a level of resistance right above the price, it was likely that DGB would be forced towards $0.0245 in the next few trading sessions, before recording another rise on the charts.
In addition, the RSI had moved above the neutral line and indicated recent bullish momentum.