
Ethereum rose from $380 to $399 on the charts and was knocking persistently on the doors of $400. Ethereum surging past $400 could revitalize the altcoin market, but Bitcoin’s movement will also have a significant say on the market.
Further down the crypto-ladder, Stellar Lumens noted steady selling pressure, while Verge registered a bullish divergence and surged past its resistance level. Algorand too exhibited a bullish short-term setup and it could record some more gains over the next few hours.
Stellar Lumens [XLM]

Source: XLM/USD on TradingView
Stellar Lumens appeared to be forming an inverted cup pattern, but noted a pullback that invalidated the pattern soon after. However, the coin has been trending lower lately.
The OBV registered a series of lower highs over the past couple of weeks as XLM lost its level of support at $0.079 and bounced off the $0.075-support level.
At the time of writing, XLM had tested the resistance level once more, but was rejected. A break to either side of the above-average trading volume would confirm the market’s next direction, with a southbound movement more likely.
Algorand [ALGO]
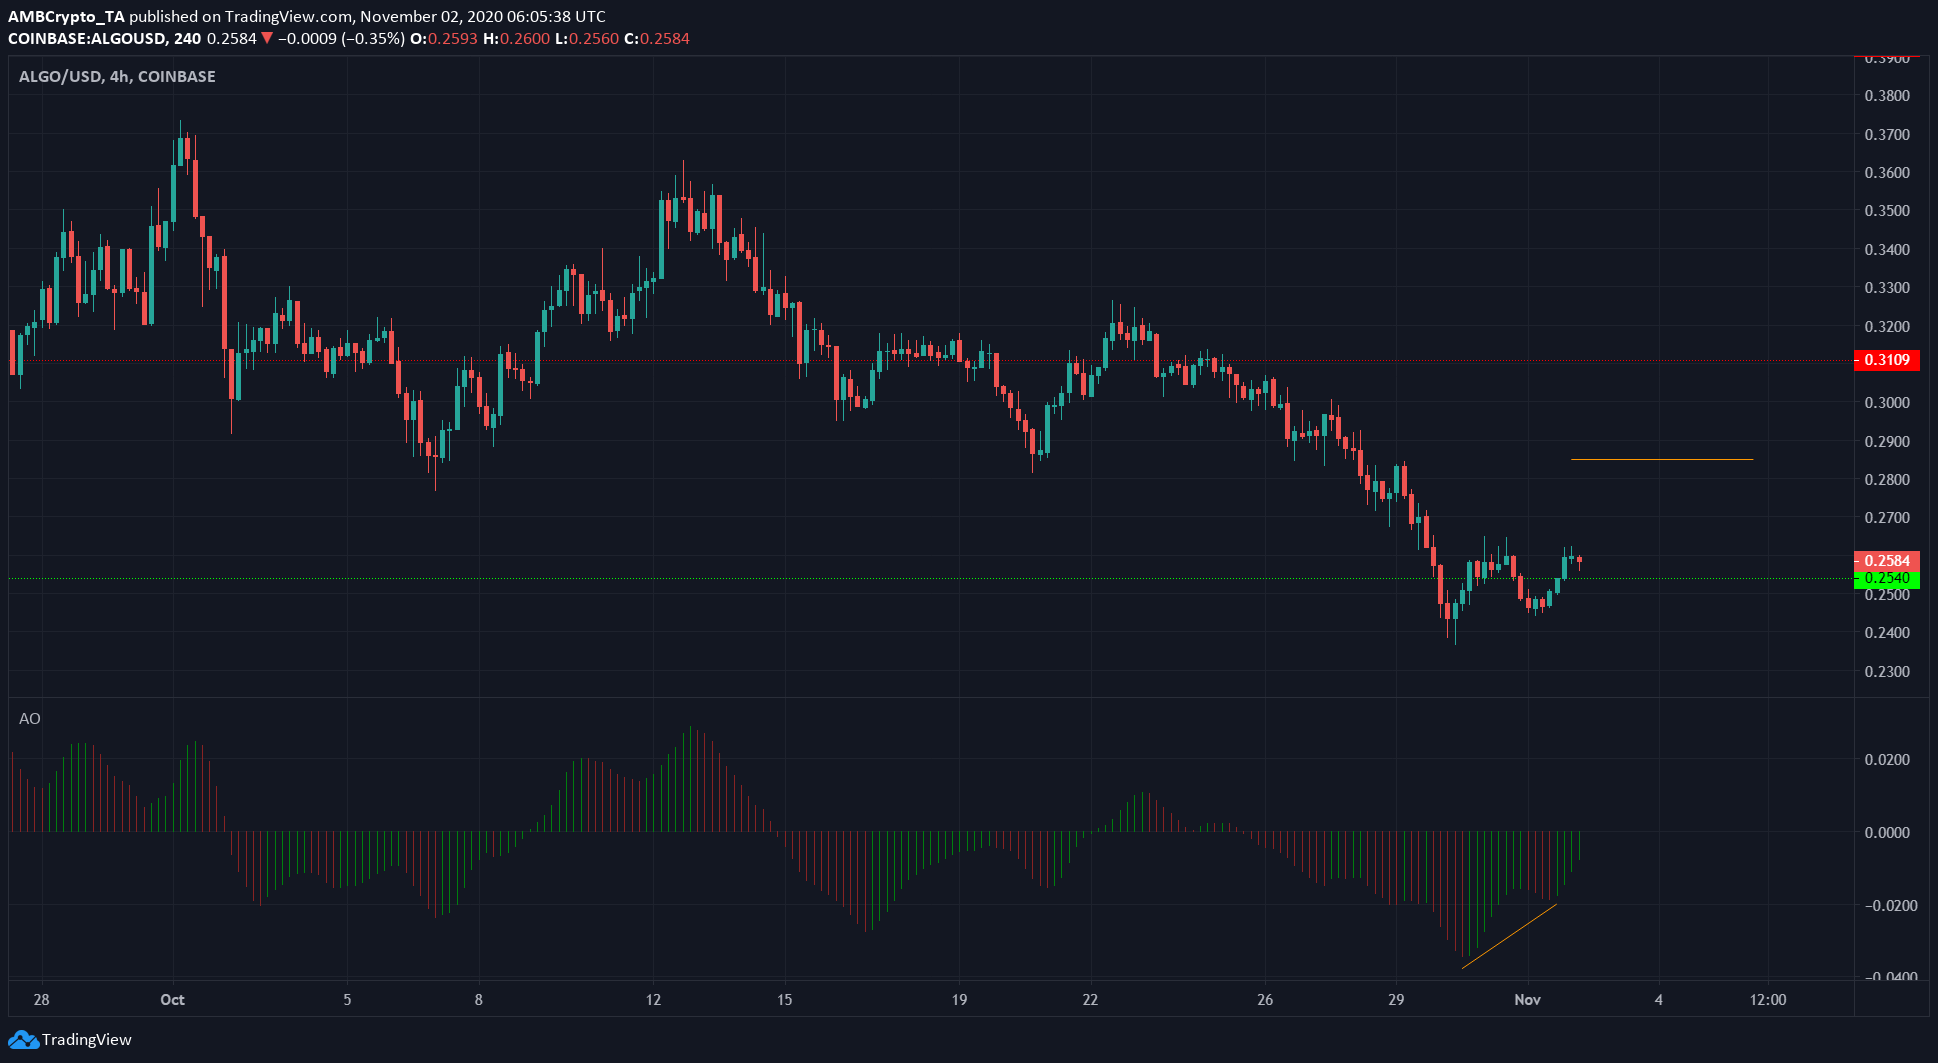
Source: ALGO/USD on TradingView
Algorand formed a bullish twin peaks setup on the Awesome Oscillator, highlighted in orange. This can act as a short-term trend reversal, and ALGO could move north to as high as $0.285.
Over a long-term timeframe, ALGO has been saw losses throughout October. A successful defense of the 0.25-support level could halt the trend, possibly giving bulls time to recover and eventually drive the prices higher on the charts.
Verge [XVG]
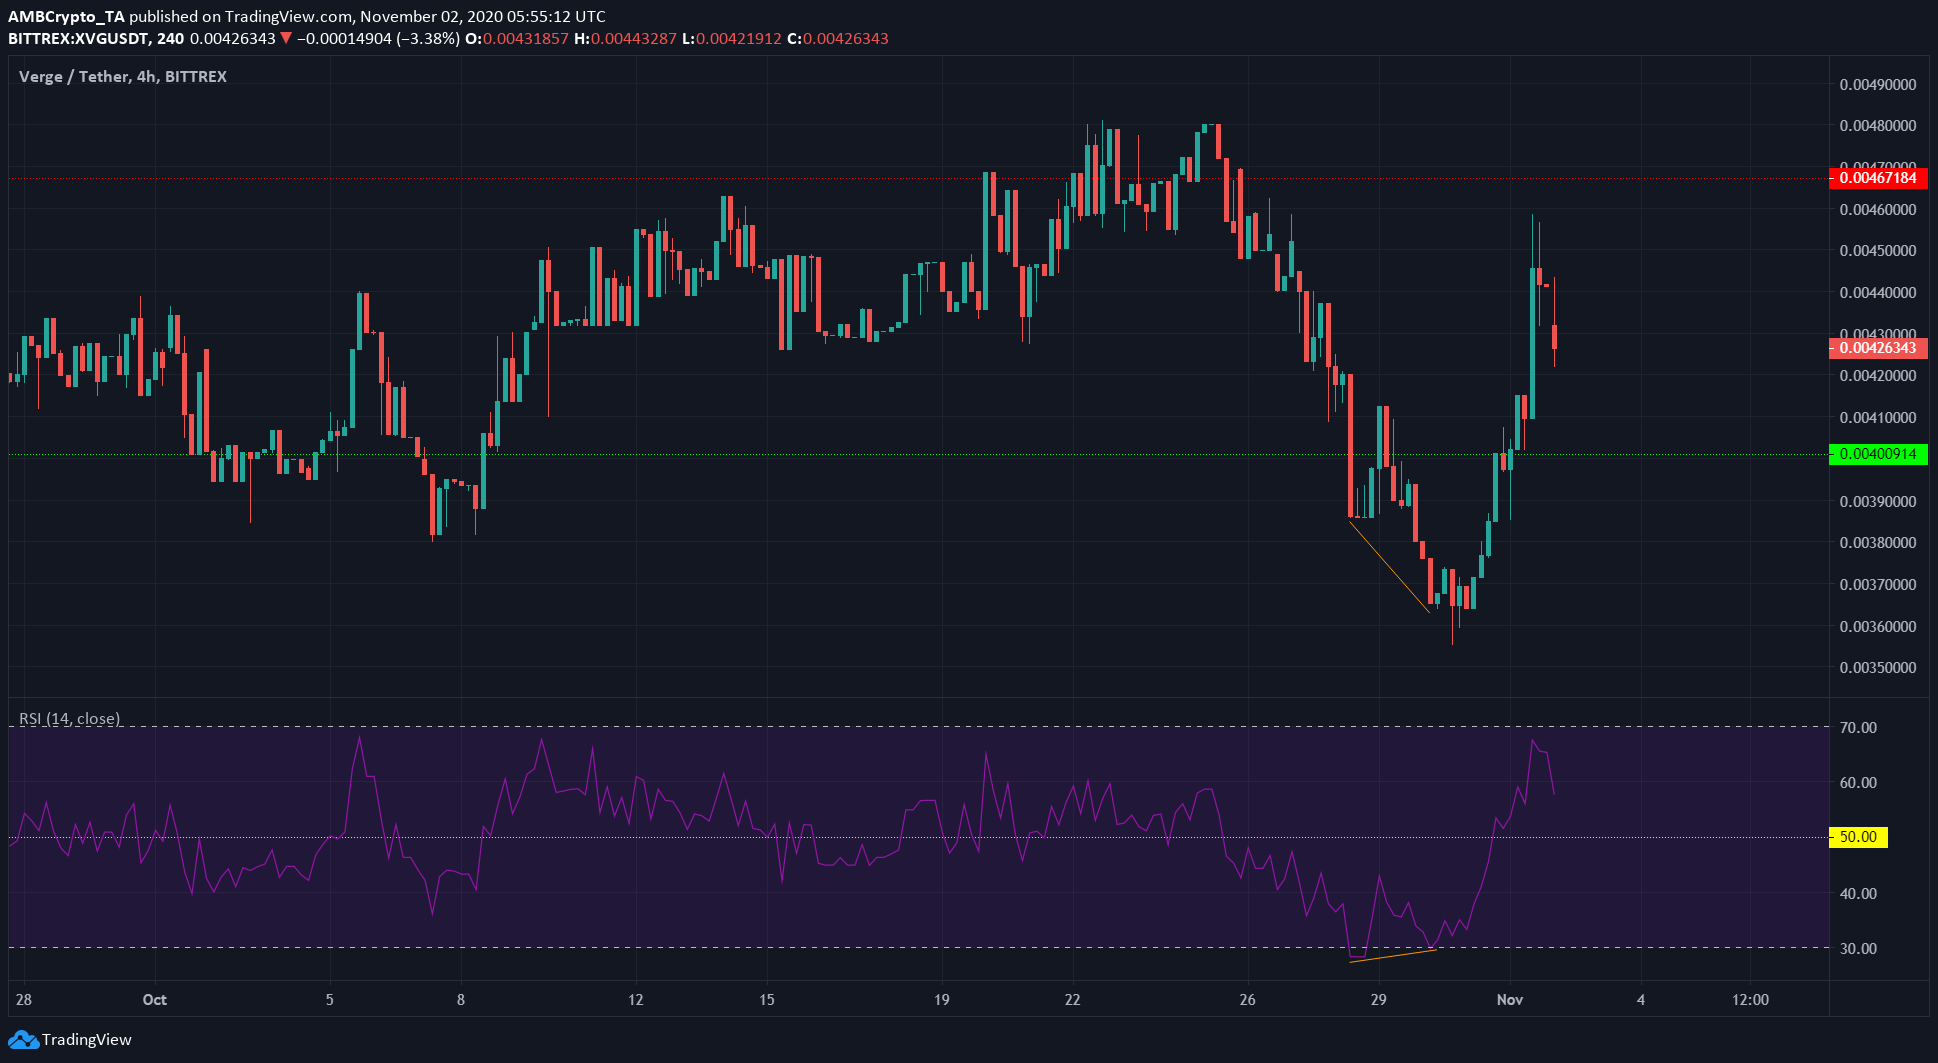
Source: XVG/USD on TradingView
Verge formed a bullish divergence on the charts. Highlighted in orange, the price formed a lower high while the momentum indicator (RSI) formed a higher high.
This disagreement between the momentum and the price saw XVG shoot upwards, as high as $0.0046, but it was pushed lower as the price pulled back.
It is possible that XVG might see a drop to $0.0041 or thereabouts before another leg up. The RSI soared above the neutral 50-zone and could test the line and move upwards, alongside the price, to signal bullish momentum in the coming days.
A loss of the $0.004 support would be bearish for XVG.