
Monero had been trading within a range over the past month, but it appeared to have initiated a recent downtrend on the charts. On the contrary, while Waves was on an uptrend that could be set to continue over the coming days, Compound’s bulls were engaged in a skirmish to flip a level of resistance to support.
Monero [XMR]

Source: XMR/USDT on TradingView
Monero was trading within a descending channel (yellow), at press time. It closed above the channel, at $124, a few trading sessions ago, but the very next session saw XMR pushed down to $118.
The trading volume showed that the selling pressure was strong, but the most recent rise from $110 to $120 was not backed by strong trading activity. This pointed to a drop in price for XMR in the next few hours.
Further, the OBV confirmed that there was some mounting selling pressure on the crypto-asset as it formed a series of lower highs over the past few days. Combined with the channel, XMR could test support at $100 in the coming days, upon another drop below $115.
Waves [WAVES]

Source: WAVES/USDT on TradingView
Waves steadily flipped levels of resistance to support over the past two weeks, with the latest level of interest being $3.55.
The RSI also noted bullish momentum and an uptrend for the coin, while the series of lower highs WAVES set was also a sign of strength from the market’s bulls.
WAVES could see a pullback to $3.4 or $3.24 if Bitcoin or Ethereum see a major move downwards over the next few hours. From that pullback, WAVES can be expected to rise once more towards its resistance level.
Compound [COMP]
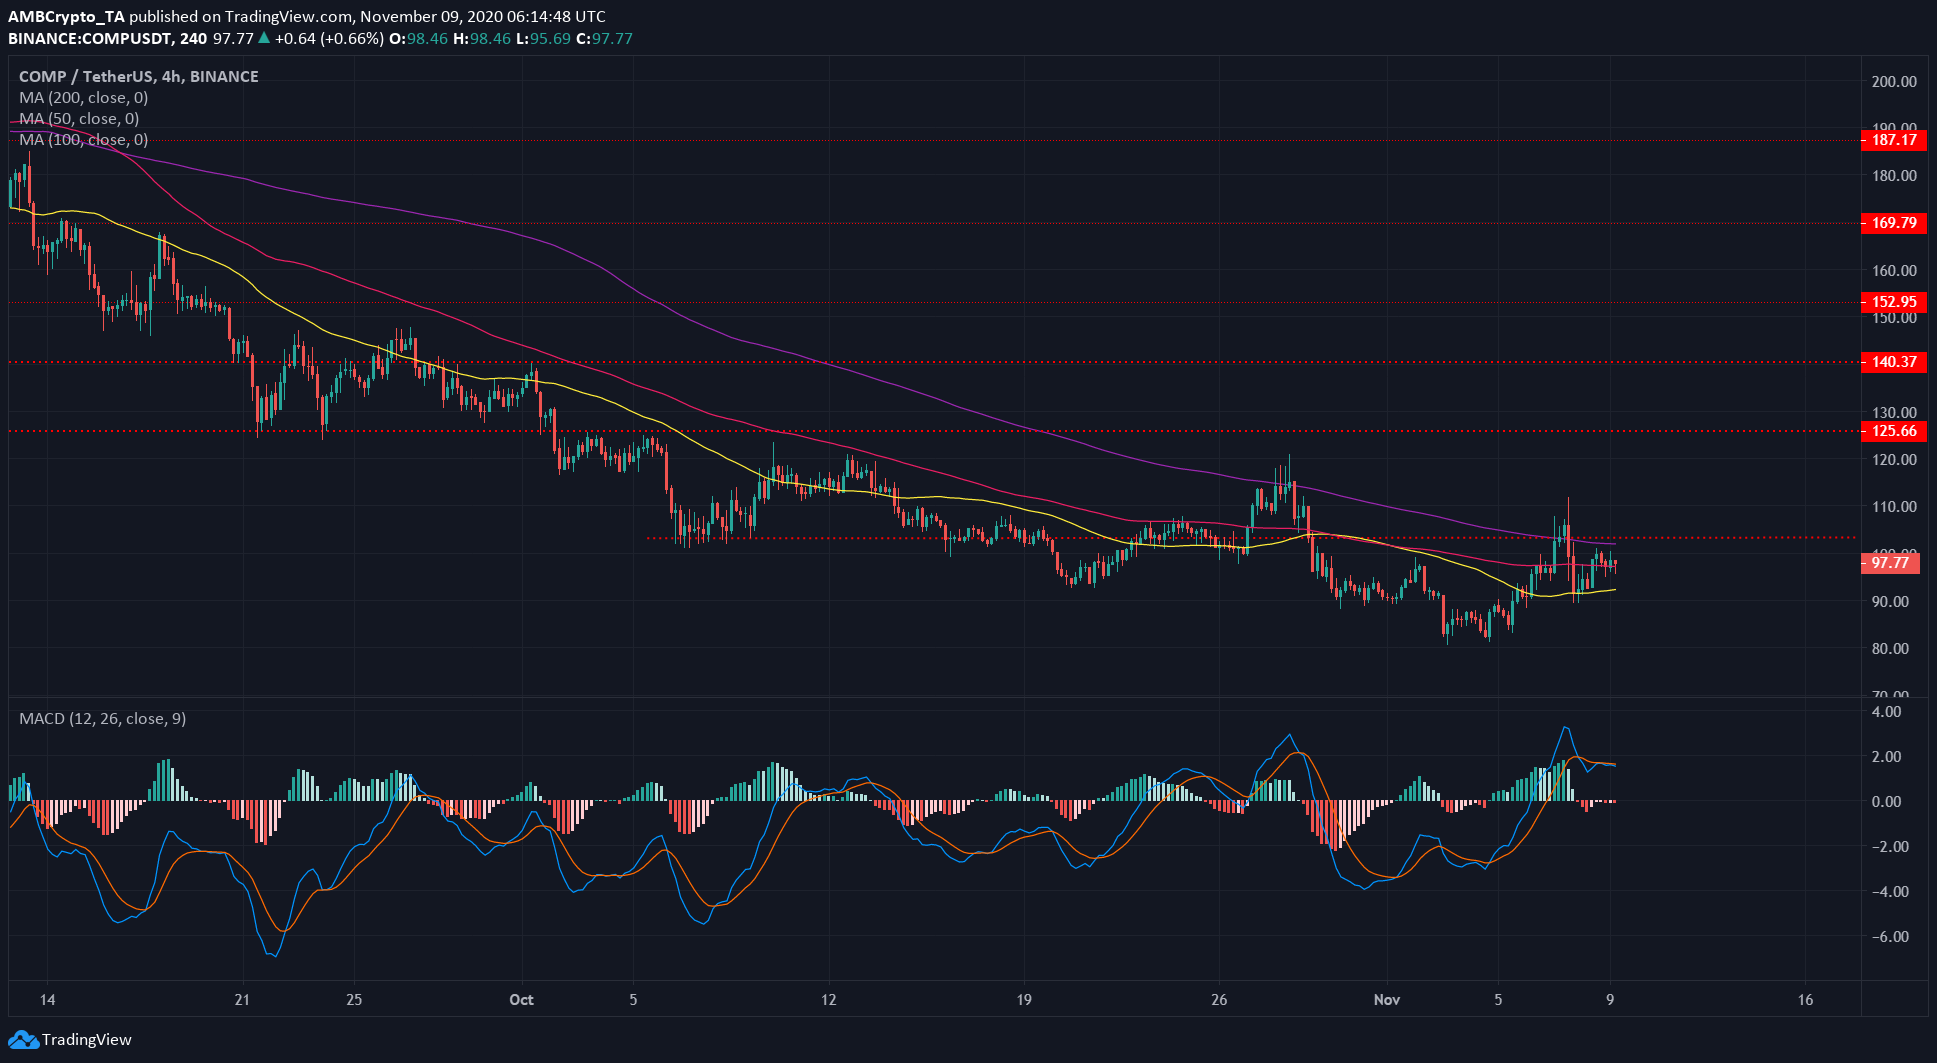
Source: COMP/USDT on TradingView
The 200-period, 100-period, and 50-period moving averages (purple, pink and yellow respectively) showed that on both long and medium-term scales, COMP was bearish.
However, the past few days did see COMP test its $100-resistance as it traded above $90 for the most part. The lack of further losses posted saw the 100 SMA inch closer to the 200 SMA, hinting at an end to the downtrend on the horizon.
The MACD was above zero, but underlines a lack of momentum over the past few hours.
Important levels to watch out for are $100 and $90. A close above $100 could inspire bullish confidence as it is also an important psychological level, while a close below $90 would signal the bears were in a position of strength.