How often should you buy Bitcoin?

Everyone has their own Bitcoin buying strategy. Some look at simple things like a particular drop in price, others look at a host of wonky indicators, while some prefer to keep it simple and keep stacking sats. Which strategy works out to be the best though?
Well, in short, there is no one perfect strategy. But there are many imperfect ones that work well. Let’s take a look at a simple one here.
Rules of the game
For starters, this strategy will only look at buying Bitcoin and not selling. Why not selling? Well, given the simple value proposition of Bitcoin being limited and usable, there is no need to devise a ‘strategy to sell’ because there is inherent value in using Bitcoin as a medium of exchange or a store of value.
Buying, on the other hand, is a complicated affair. Not just from the point of view of regulatory loopholes (depending on where you live), exchanges used, custody solutions, third-party payment solutions, and trading pairs used, but also from the point of view of timing. What does timing imply? Timing simply implies when should we execute the ‘buy,’ and when should we wait, or not execute it.
To simplify this binary execution of – to buy or not to buy – let’s create two specific actions,
- Buy and Hodl Bitcoin
- Buy USDT
Here, the options are fairly simple. You either buy and hodl Bitcoin, or buy USDT with the intention of buying Bitcoin. So, whichever route you take you’d be buying Bitcoin eventually.
Now that we have the action, let’s look at the trigger. What’s the trigger? A trigger would be the sign that would make you choose between the first or the second option above i.e. when should we buy and hodl Bitcoin versus when should we buy USDT (to buy Bitcoin)? Let’s use a tried and tested strategy for this.
The 200-day moving average (DMA) looks at the average price of Bitcoin over the past 200 days, an effective measure of how the current price has fared against its medium-term past. In a recent report by Ecoinmetrics, the strategy was laid out very well. Nick, the author of the report, laid out a simple two-point approach that we’ll be following, albeit with a modification. His 200DMA strategy was,
- When BTC moves above its 200-day moving average, go long
-
When BTC is crossing back below its 200-day moving average, close the position
In Nick’s words, “when it comes to trading, it is best to keep it simple.” Wise words, which will be at the heart of this strategy as well.
Using Nick’s two-point approach, and the two options mentioned above, the crux of this buying-only strategy will work like this,
- Buy Bitcoin when its price trails over the 200 DMA
- Buy USDT when Bitcoin’s price trails under the 200 DMA
- During a crossover i.e. when Bitcoin’s price trails over the 200 DMA, from under it, with the accumulated USDT, buy Bitcoin
Seems simple enough, right? Two points with the third mainly a caveat, and only a one-way transaction i.e buying and hodling, and just one base currency, USDT. This clears the clutter of looking at trends that are absent or breakouts or breakdowns which are phallic. Nick put it best when he said,
“Less risk of messing up execution. Less risk of seeing patterns where there aren’t any. Less risk of over-engineering something that should be straightforward.”
Assessing the field

Source: BTCUSD via TradingView
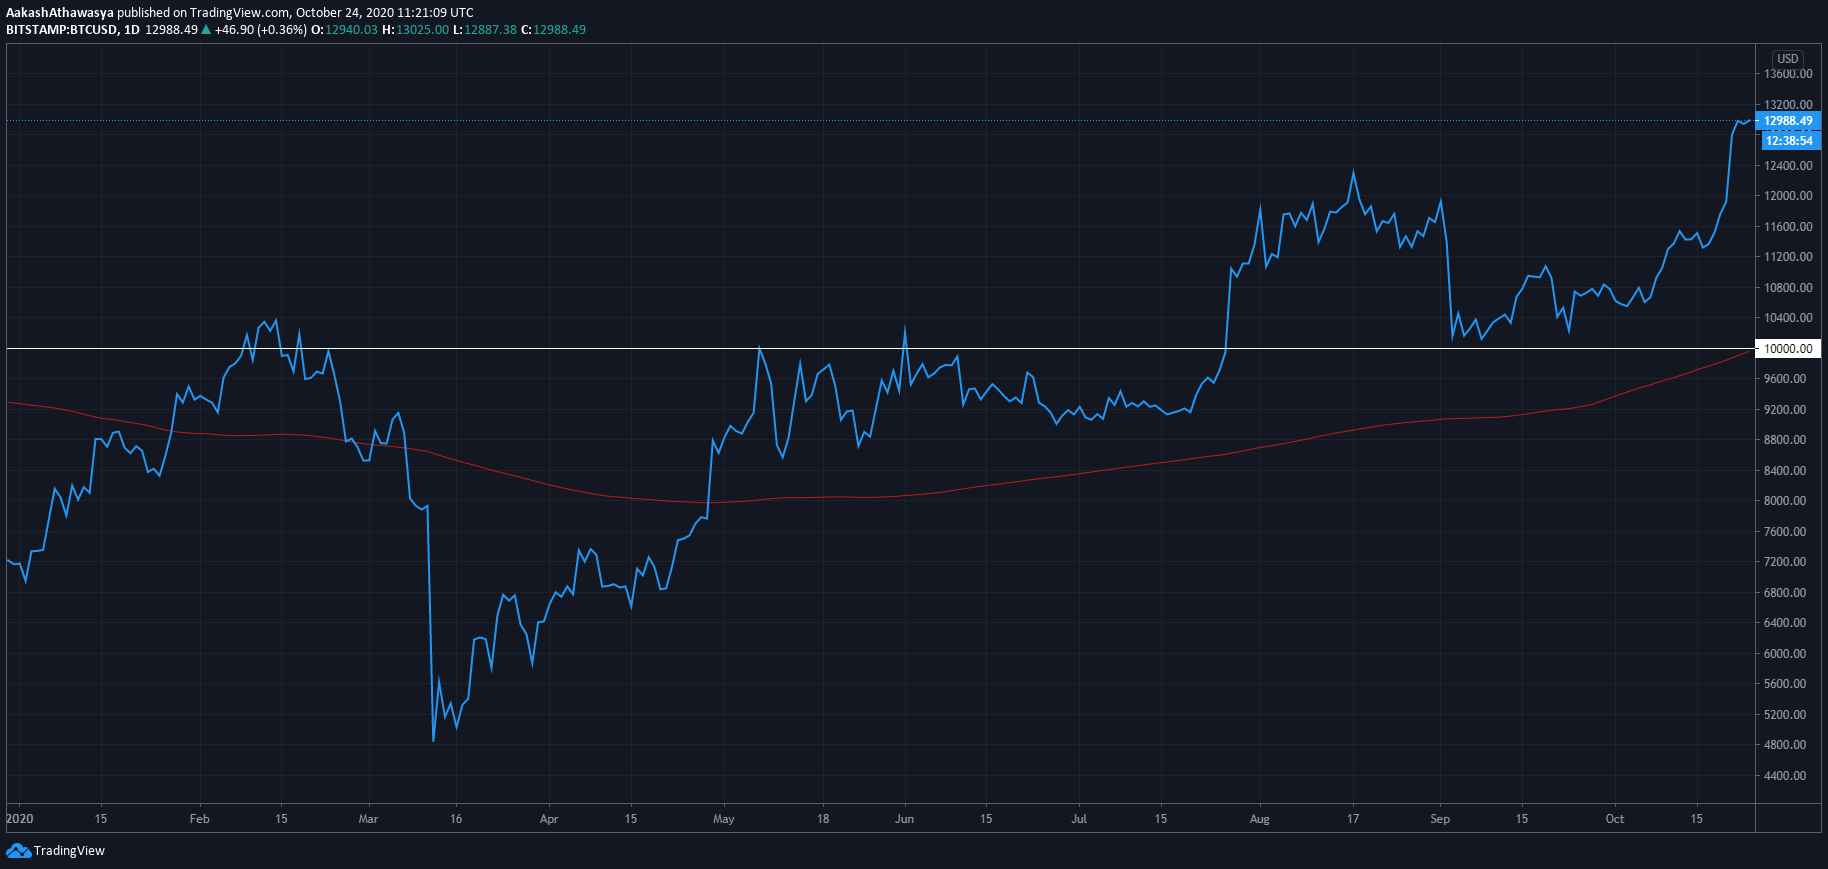
Here’s the price chart for Bitcoin in 2020 plotted with the 200 DMA in red. As can be seen, Bitcoin’s price began below the DMA on 1 January, and only by 28 January did it flip over the average. This move over the DMA continued till 27 February, before the average caught up.
With the March drop and recovery, the daily price was below the 200 DMA from 27 February to 29 April, more than two months! However, since then, it has maintained itself well above it. It should be noted that since the DMA is after all a moving average, since 29 April, it has risen by 16.7 percent, something that is no small feat.
So, where does this leave our strategy? Well, on pretty straight forward terms actually.
| Action | Days |
| Buy USDT days | 84 |
| Buy and Hodl BTC days | 190 |
| Total days | 274 |
Table 1.0: Bitcoin and USDT buy days by days
Out of the 274 days between 1 January and 30 September, we have 84 days below the 200 DMA. So, 84 days of buying USDT (split into three periods), and 190 days of simply buying and hodling Bitcoin. Remember, no selling!
Assume the position
It’s best we have some structure before we proceed, mainly so that we don’t cheat ourselves and start painting patterns on the charts and ‘over-engineer’ anything, like Nick said. Hence, a few assumptions are in order,
- We’ll only look at selling
- We’ll only have two options at all times – buy Bitcoin, and buy USDT to buy Bitcoin
- We’ll only use one signal – the 200DMA as a trigger to enter and exit each option
For a more active scale, let’s look at daily Bitcoin-buying activity. Why daily? Well, for starters, the 200 DMA does look at a daily moving average, and like the above table shows us, Bitcoin’s daily price is divided into two slots – buy Bitcoin and buy USDT, with the latter further divided into three buckets of buying, presented below.
| Buy USDT | Days | Period |
| First buy | 27 | 1 January 2020 to 27 January 2020 |
| Second buy | 5 | 27 February to 2 March |
| Third buy | 52 | 8 March to 28 April |
Table 2.0: First, second and third buy USDT days and date ranges
Now that our assumptions are set, let’s scale it.
$1 Spare change
So, now that our rules, options, assumptions, and potential fallacies are set, let’s see how it plays out for the first 9 months of the year.
For this first, ‘spare change’ iteration, let’s look at a simple one dollar a day strategy of buying based on the above. This popularly called ‘dollar-cost averaging’ strategy aims to buy Bitcoin every day, irrespective of the high or low price. But since we’re applying our strategy based on the USDT buying and 200 DMA to it, the results are bound to be different, maybe even more profitable.
Broadly speaking, these would be our results,
| $1 bought category | Amount | Average price |
| Bitcoin bought when price > 200DMA | ₿ 0.019167 | $ 9,996.32 |
| USDT bought when price < 200DMA | $84 | $ 7,317.05 |
| First USDT buy amount | $27 | $ 9,146.08 |
| First USDT buy amount in BTC | ₿ 0.002952 | $ 9,146.08 |
| Second USDT buy amount | $5 | $ 8,452.30 |
| Second USDT buy amount in BTC | ₿ 0.000592 | $ 8,452.30 |
| Third USDT buy amount | $52 | $ 8,302.63 |
| Third USDT buy amount in BTC | ₿ 0.006263 | $ 8,302.63 |
| Total BTC via USDT | ₿ 0.009807 | $ 8,633.67 |
| Total BTC bought | ₿ 0.028974 | $ 9,315.00 |
Table 3.0: $1 strategy – Bitcoin and USDT with an average price
At first, this table may be confusing, but let me explain. The first two rows are how much Bitcoin and USDT you’d buy. This means that if you’d bought $1 of Bitcoin every day between 1 January and 30 September, when its daily price was over the 200 DMA and bought $1 of USDT when Bitcoin’s price was below the 200 DMA, you’d have,
- BTC 0.019167, and
- USDT 84
Here’s the fun part. The immediate day after the price crossed above the 200 DMA, the accumulated USDT you’d have would be used to buy Bitcoin. So, the first crossover was on 28 January i.e. one day after 27 January, when the price was $9,146. Similarly, the second crossover was on 3 March i.e. one day after 2 March, when the price was $8,452, and the third was on 29 April when the price was $8,302.
So, all in all, you’d buy Bitcoin directly, for $1, on 190 days, and thrice for USDT via lump sums of $27, $5, and $52, based on the three dips below the 200 DMA. How much Bitcoin does that leave you with?
A total of BTC 0.0481 at an average purchase price of $9,315 i.e. 15 percent lower than the trading price at the end of the studied period i.e. 30 September and 39 percent lower than the current price of over $13,000. A good enough premium, or profit, based on a simple strategy right?
As you are
Now that we’ve seen how a simple buy-only strategy works out, let’s try to scale it out further to see just how deep the profits can go. Let’s try adding more capital because let’s face it, a $1 investment seems a little too meager given the performance of Bitcoin. However, in order to stay disciplined, we’ll limit our options to two, our indicator to one, and our principle of no selling at all times.
Stick around for the follow up to this article to see how far we can stretch this strategy, and whether simplicity can work its wonders.


