EOS, DigiByte, Tezos Price Analysis: 30 September

Tezos appeared to resume its larger downtrend and was likely headed to a lower price point after facing another wave of selling pressure. DigiByte appeared to be in a period of consolidation. EOS indicated a possibility of rising above resistance to flip the level to support, but the market was undecided at the time of writing.
Tezos [XTZ]

Source: XTZ/USD on TradingView
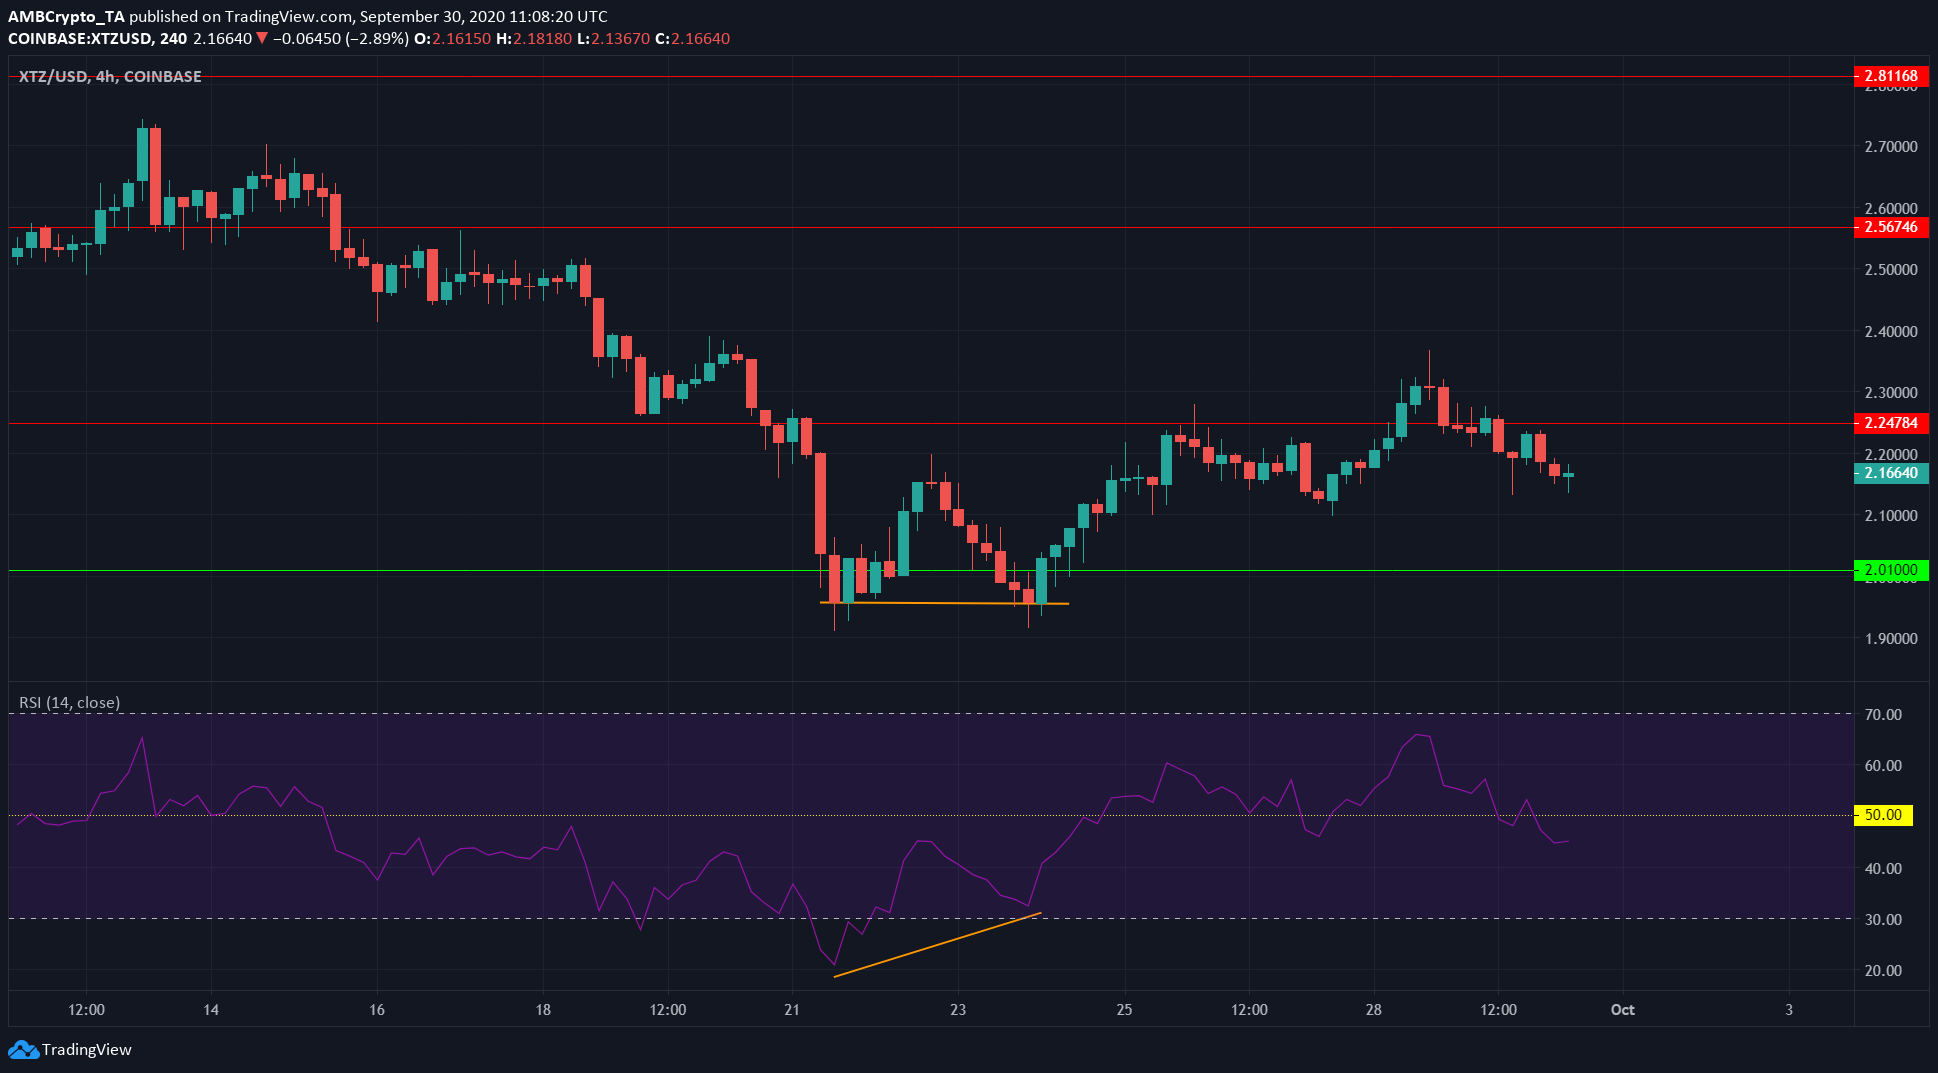
Tezos formed a double bottom pattern a few days back, which also gave a bullish divergence on the RSI, highlighted in orange. On the back of this, the price surged to reach $2.36 but was unable to hold on to the level.
The prior bearish trend imposed itself on the asset and the surge proved to be no more than a bounce.
RSI showed a value of 45 and could be headed lower if bears stepped in. The next levels of support for the asset lie at $2 and $1.8.
DigiByte [DGB]

Source: DGB/USD on TradingView
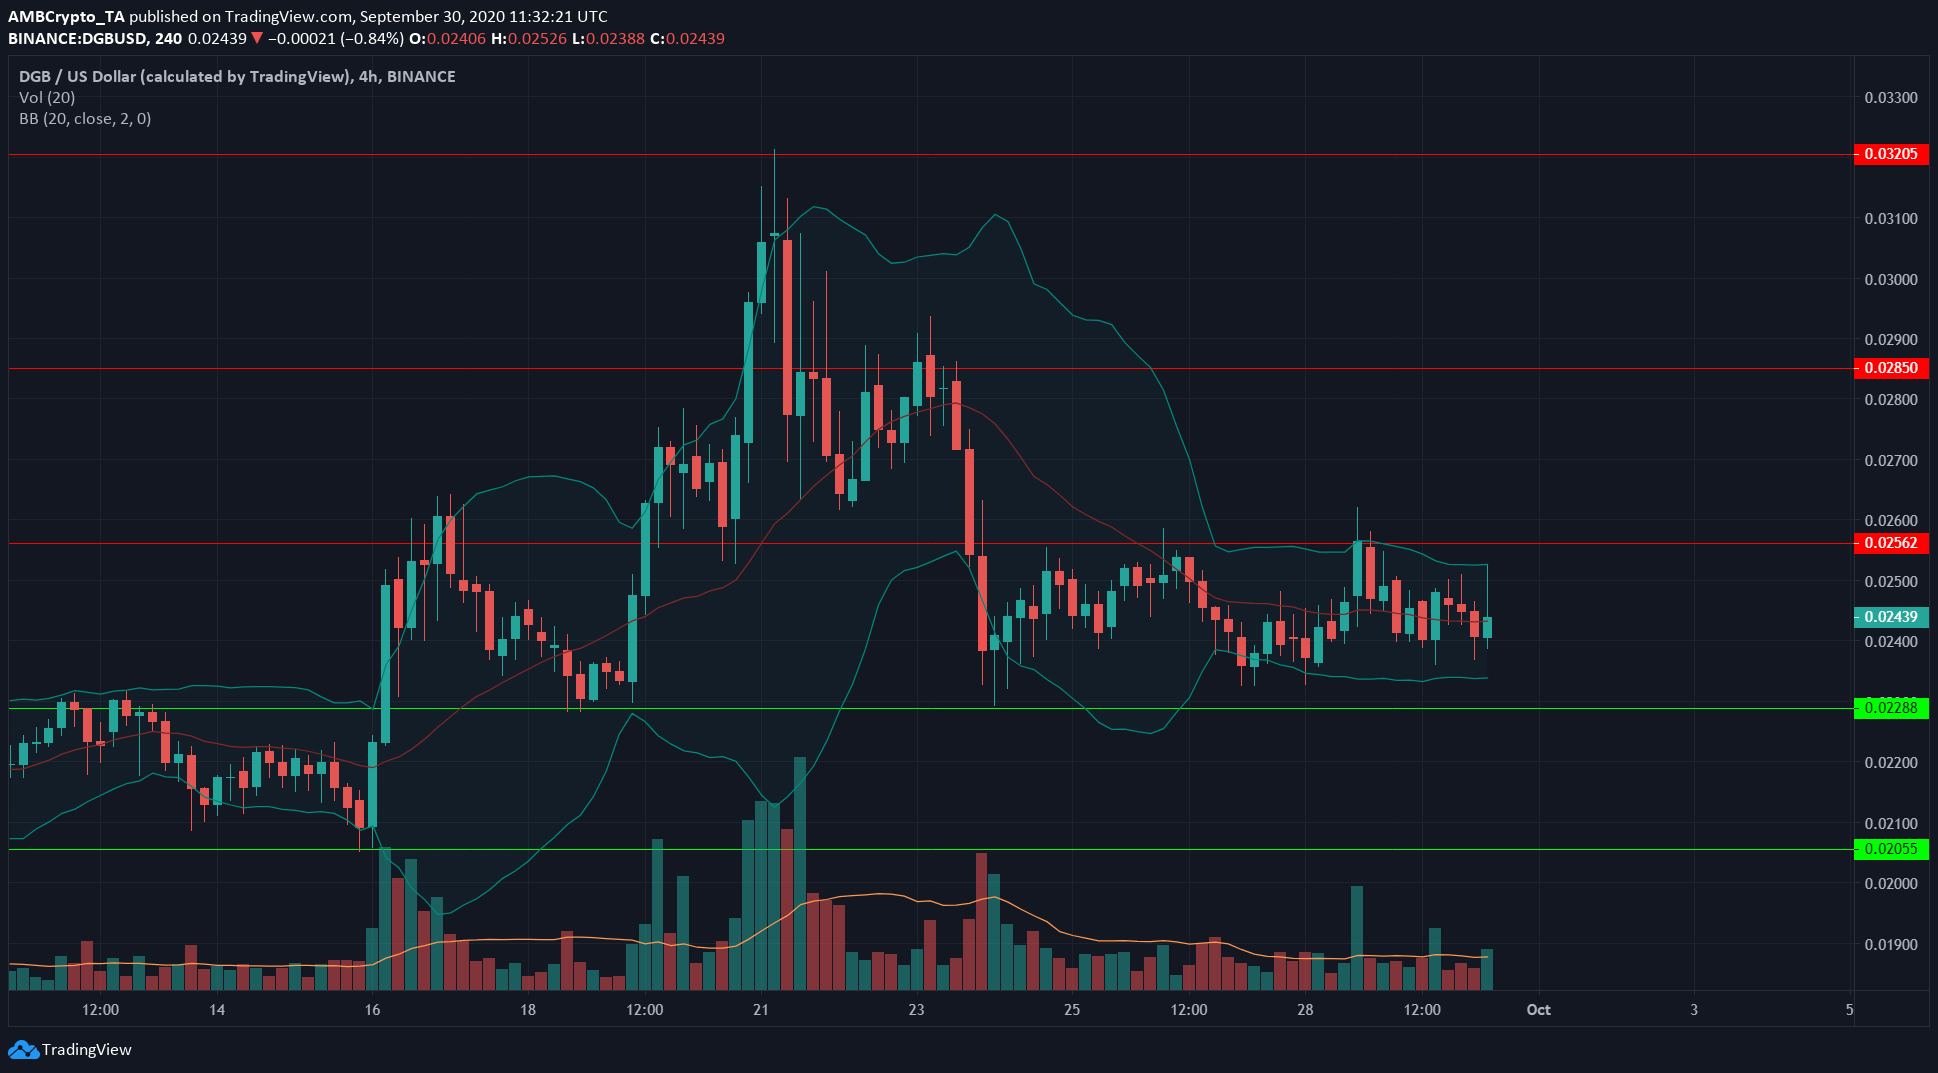
The Bollinger bands were relatively tight around the price. Trading volume was also in a falling trend, indicating a period of consolidation.
While the past few weeks have seen strong surges, they’ve also seen rapid drops. DGB has been unable to keep the gains it made. It is possible that the next direction of break out for DGB could follow the direction of the larger trend, which was a downtrend from mid-August.
Widening Bollinger bands, accompanied by soaring trading volume, would confirm the direction of DGB break out.
EOS

Source: EOS/USDT on TradingView
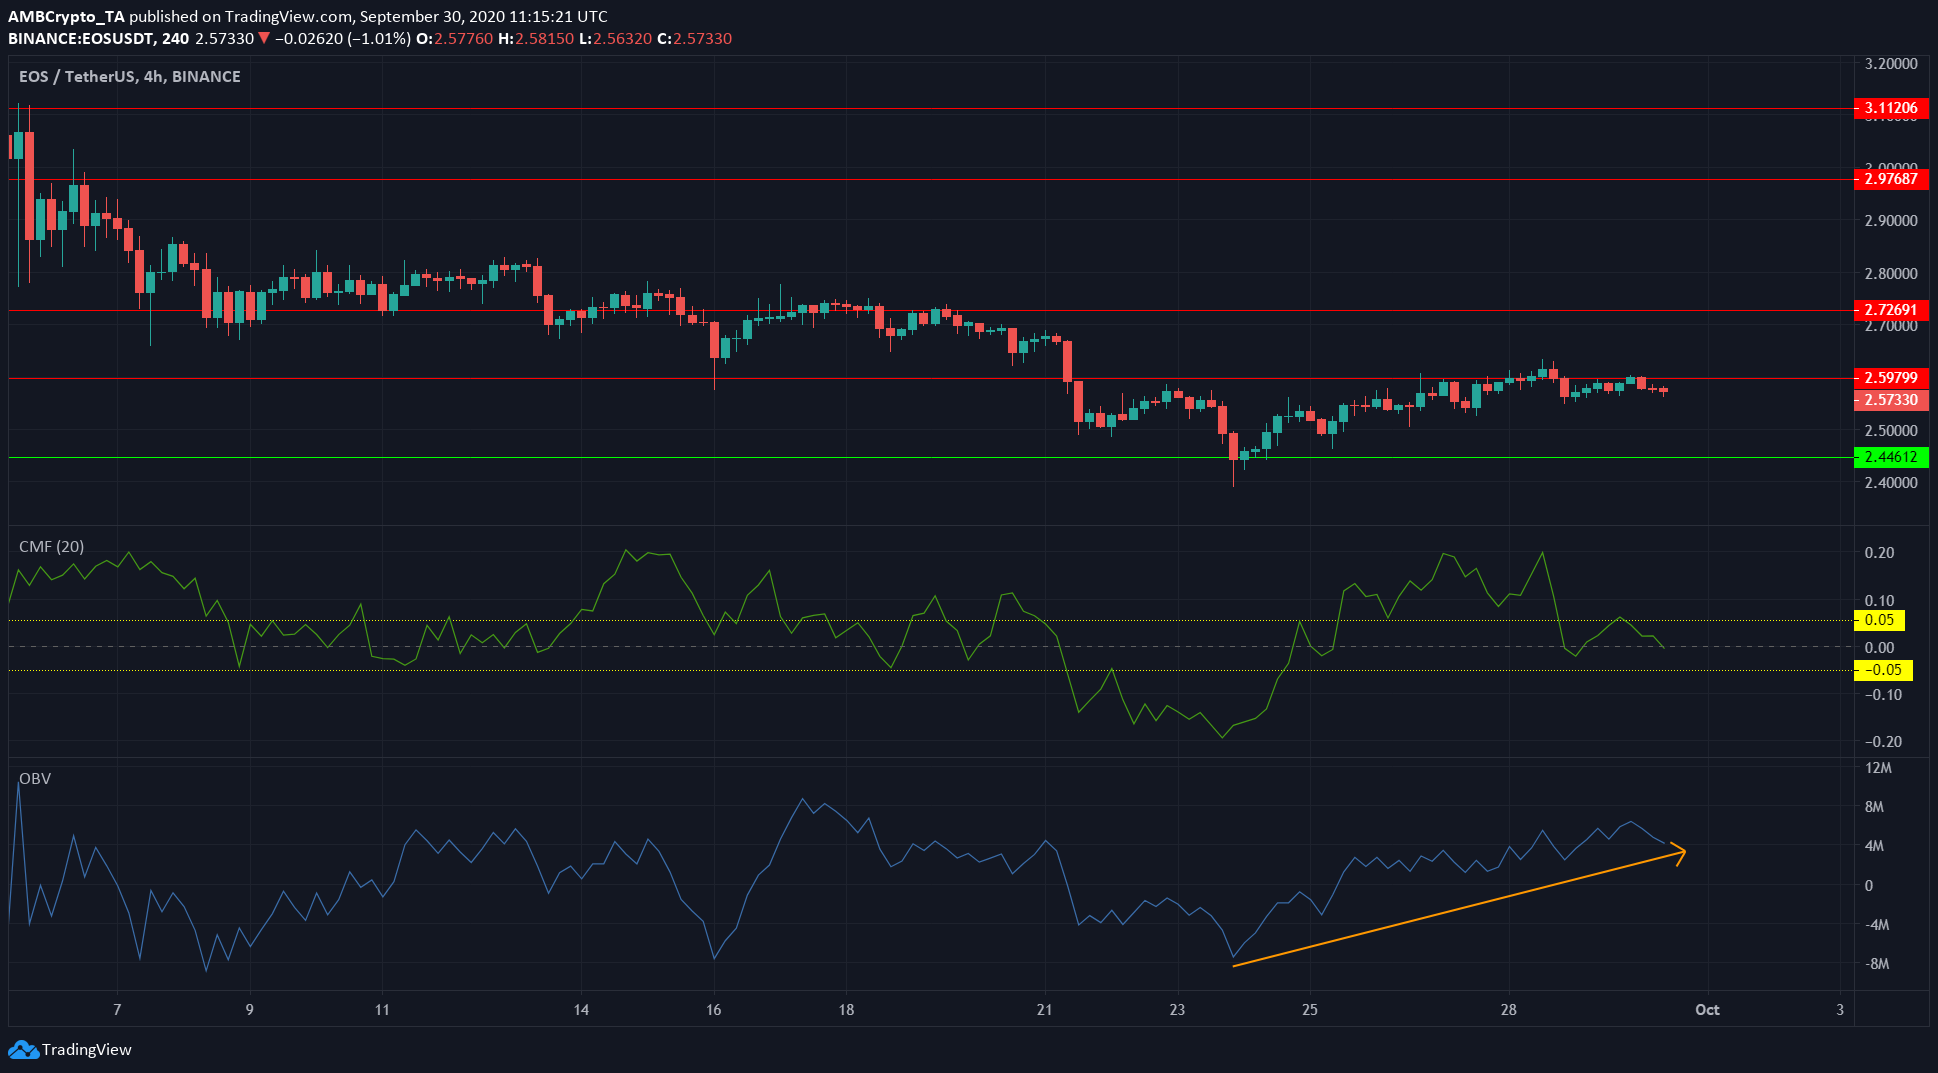
On a longer time-frame, EOS has been moving between $2.89 and $2.38 for much of 2020. At the time of writing, EOS held a value of $2.57, with an imminent level of resistance at $2.6.
In the near-term, the price was making higher lows and approached $2.6 on the back of a steady uptrend. OBV backed this rise, with buying volume outweighing selling volume in this period of time.
Chaikin Money Flow showed that, at press time, buyers and sellers were at equilibrium, with no notable capital flow into or out of the market.
It is likely that indecision at resistance, in a larger downtrend, could lead to a price drop. It is also possible that the bulls can continue grinding the price upward steadily, as they have for a week.


