Crypto.com Coin, FTX Token, Decred Price Analysis: 28 February

While 2021 saw the cryptocurrency market surge by substantial margins, the past week has seen a trend reversal. The altcoin market has always followed in Bitcoin’s footsteps and as BTC hit the $45k level, it wasn’t surprising to see many of the altcoins endure price corrections.
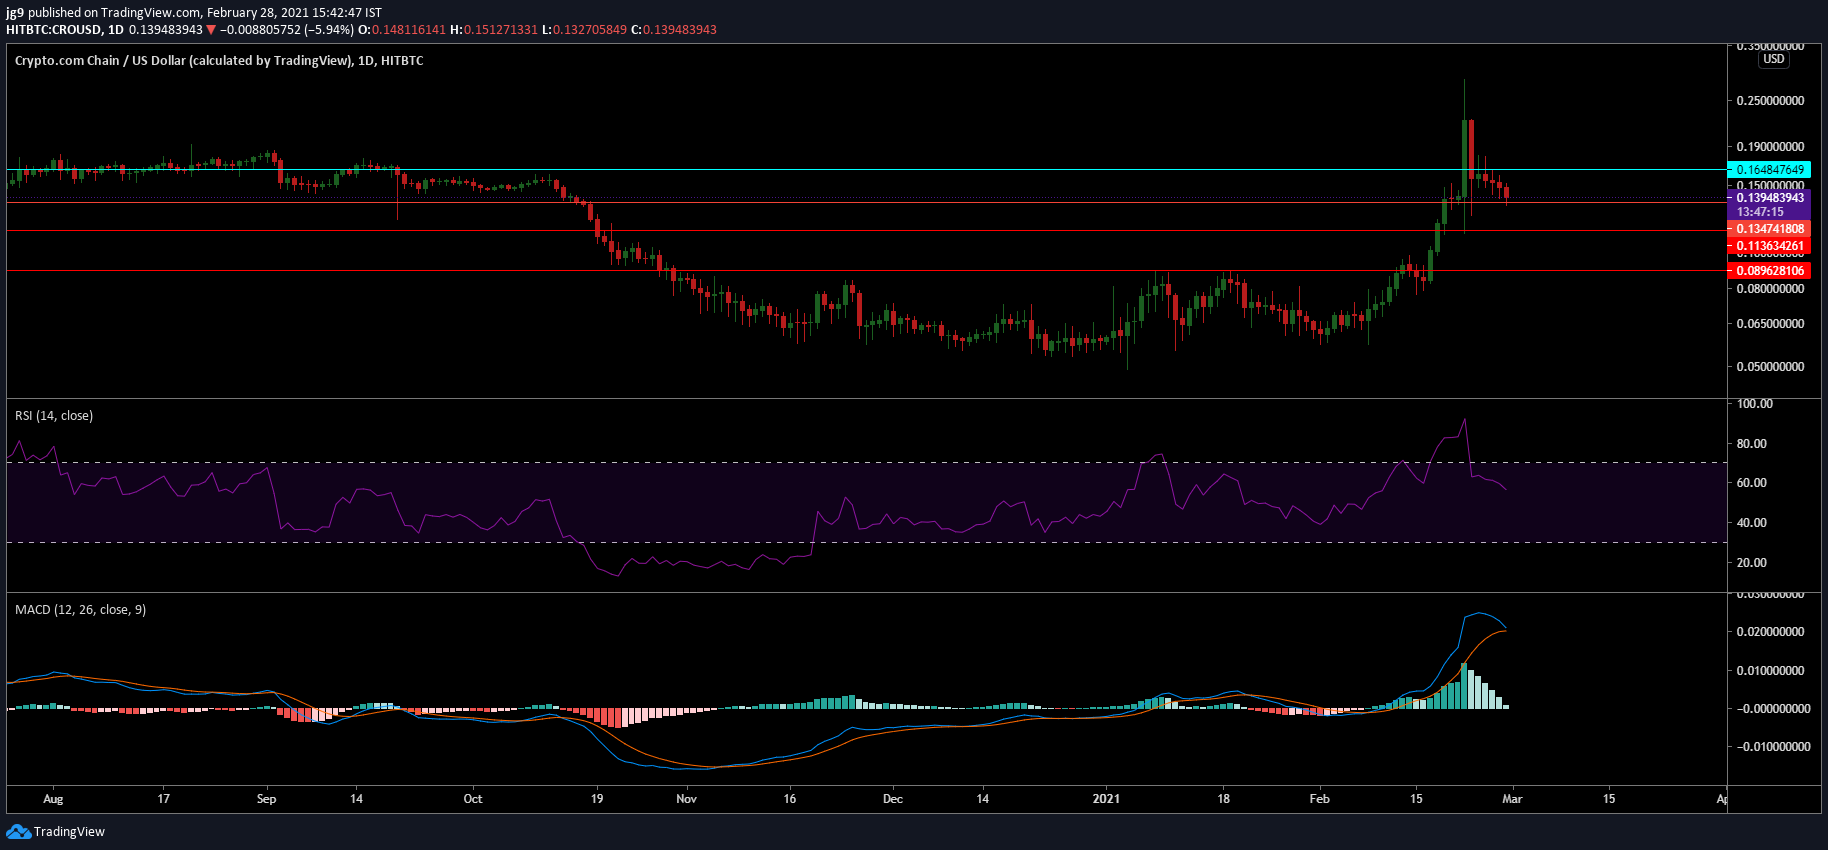
Crypto.com Coin [CRO]

Source: CRO/USD, TradingView
CRO has had to endure a price drop of over 7 percent in the past day’s time and currently trades at $0.140. The coin has a market cap of over $3.4 billion and finds itself testing the support at $0.13. There is strong resistance around the $0.16 range and if the coin were to trade lower in the coming days then it can also rely on supports at $0.11 and $0.08.
The RSI indicator has exited the overbought zone and is now heading towards the neutral zone. The price may endure further correction as the MACD indicator is heading towards a bearish crossover as the signal line rises quickly.
FTX Token [FTT]

Source: FTX/USD, TradingView
Akin to the previous coin, FTT has also had to endure a prolonged period of bearish pressure. The coin currently trades at $26.39 and has noted a market cap of $2.4 billion. FTT’s price is close to its support at $24.5 and if this support is breached the next level where the price could stabilize is all the way down at $18.7. There is strong resistance around the $35.8 price level.
The RSI indicator is currently heading towards the oversold region after having spent time at the overbought zone. The Bollinger Bands are fairly wide and indicate the presence of volatility in the coin’s price action.
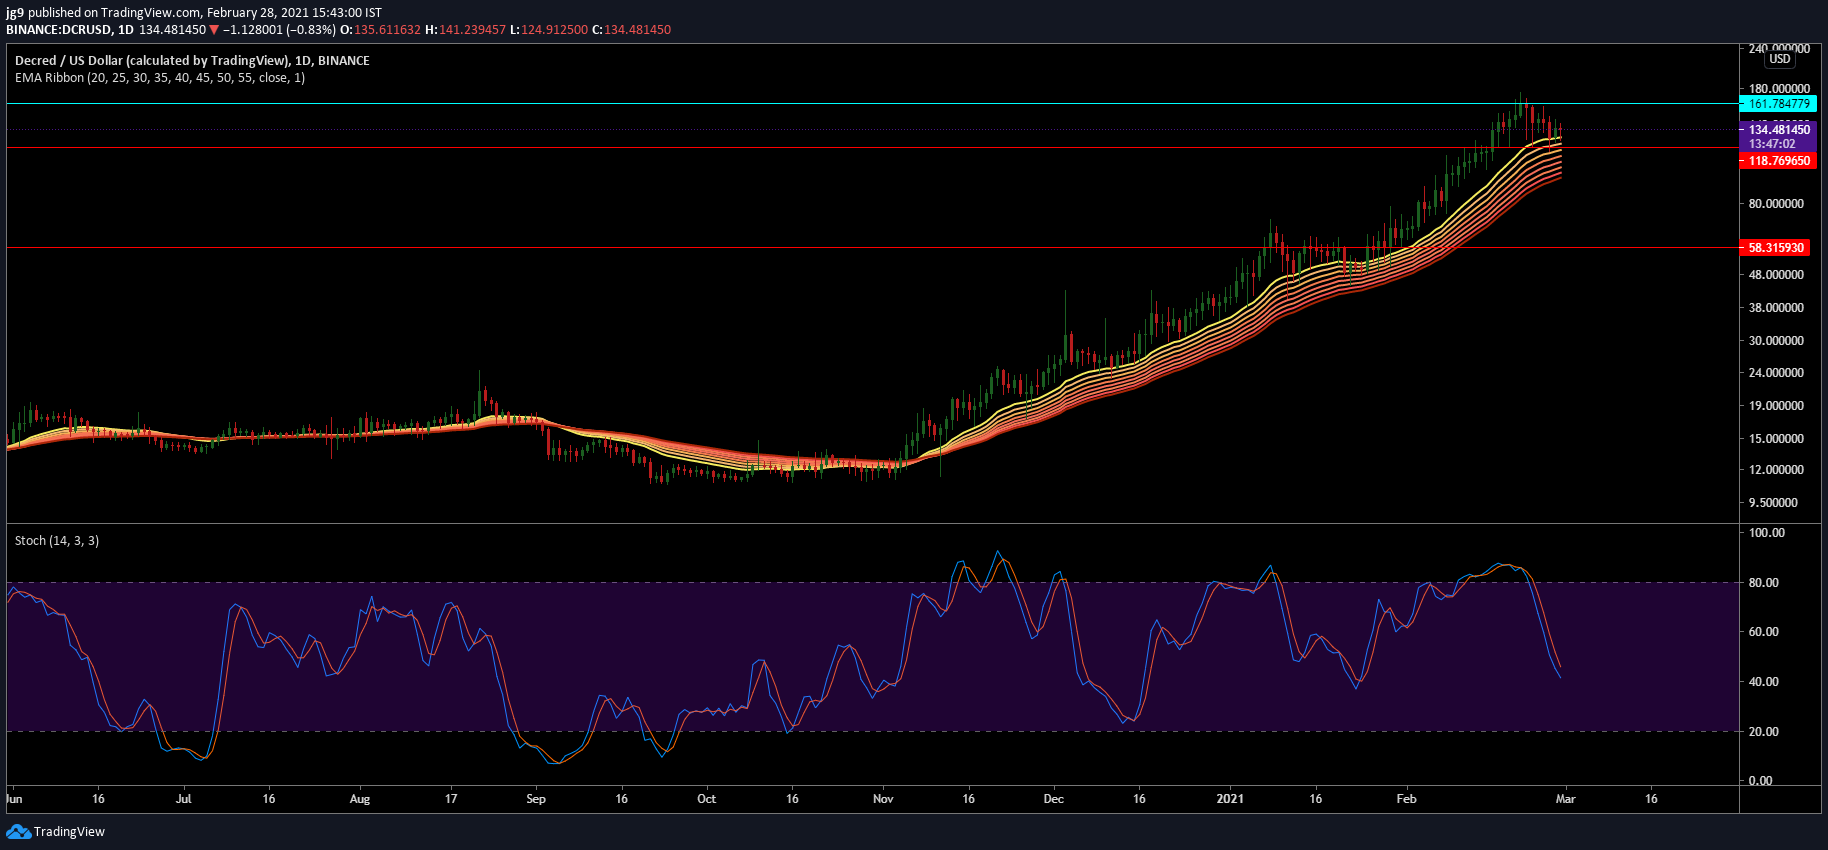
Decred [DCR]

Source: DCR/USD, TradingView
Decred currently trades at $134.13 and has a market cap of over $1.7 billion. The past few days saw DCR trade within the confines of its immediate resistance at $161.7 and its support at $118.7. If the bearish pressure were to increase considerably the coin’s next support is all the way down at $57 – a price point that was last seen towards the end of January 2021.
The EMA ribbons are likely to offer support after having settled below the current trading price. The Stochastic indicator looks bearish as it now finds itself in the oversold zone.


