
Bitcoin’s price has been aggressively surging in 2020, breaching key resistances over the past 7 weeks. The crypto-asset briefly crossed $10,000 on 10 February, but a quick correction of $450 followed right after. At press time, Bitcoin was priced at $9870, with the world’s largest cryptocurrency noting a small positive change of 0.26 percent over the past 24 hours.
1-day chart
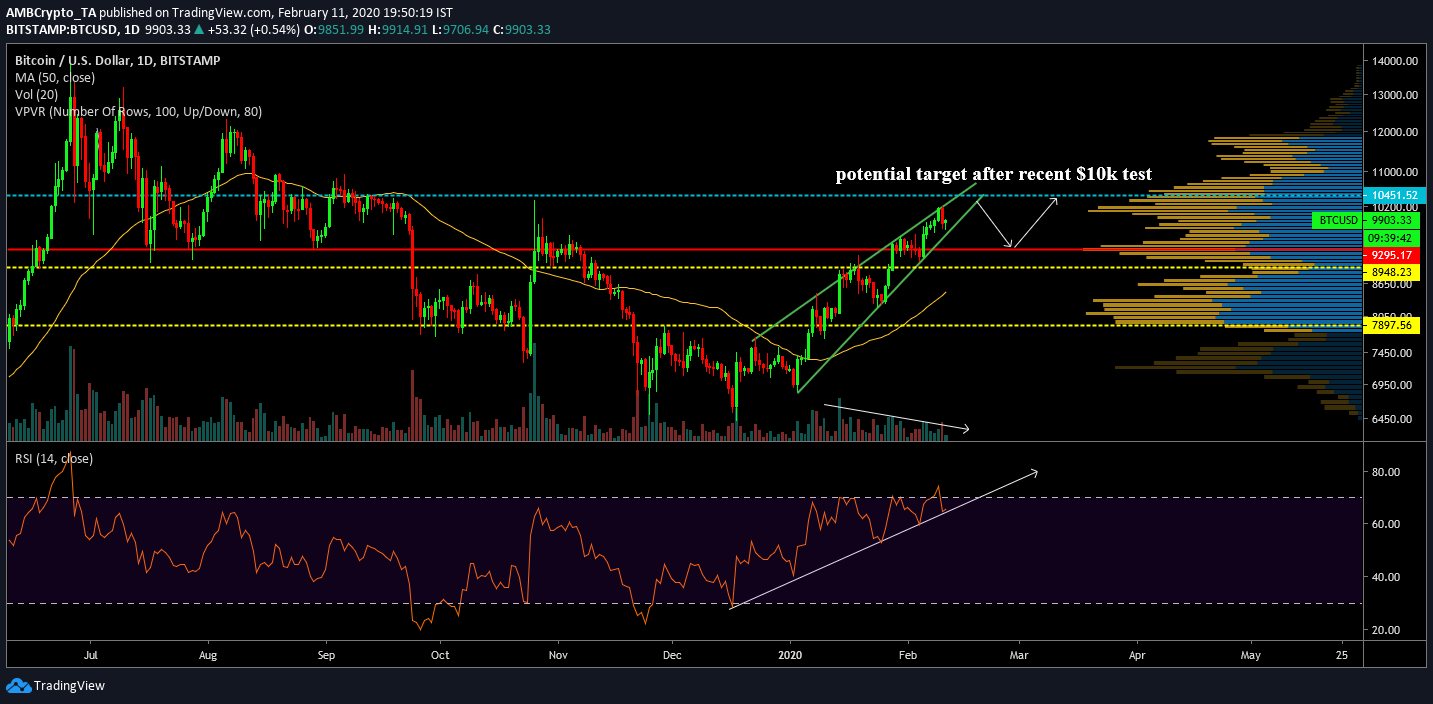
Source: BTC/USD on Trading View
The periodic rise in Bitcoin’s valuation is clearly observed in the long-term during which, major indicators have turned bullish with respect to the trend. The present price movement pictured the formation of a rising wedge that registered 7 touches within the trend lines, confirming the validity of the pattern.
A rising wedge is generally followed by a price correction, but over the past few weeks, besides the 6 percent slump on 10 February, the price has consolidated at a higher range. At press time, a drop below $9600 was deemed less likely by the community, but corrections are about what the market needs and not what the community wants.
The Relative Strength Index or RSI has also maintained a bullish rise alongside Bitcoin’s price, highlighting the stronghold of the bulls in the market. However, a period of consolidation is a healthy sign in the market and without corrections, Bitcoin is unlikely to breach future resistances.
According to the VPVR indicator, the point-of-control for significant trading volume was sketched at $9295 since the start of July 2019. A bearish breakout should see Bitcoin register a decline down to the PoC. After the re-test of support at $9300, Bitcoin’s price may target a potential re-test of resistance at $10,451 by the end of March.
The trading volume has been declining since 14 January. However, this should experience a spike as well following the pattern breakout.
Incoming Golden Cross?
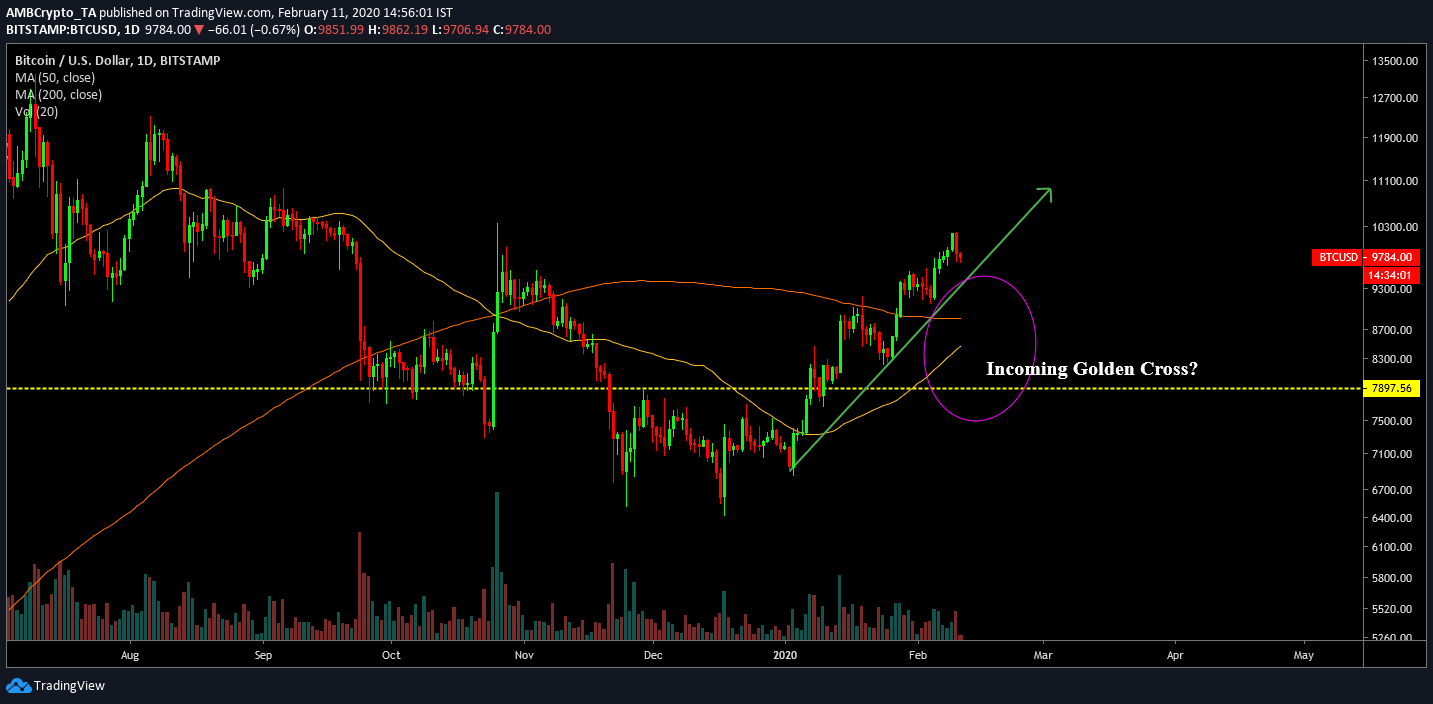
Source: BTC/USD on Trading View
An important bullish sign currently developing in the long-term chart is the movement between the 50 and 200-moving average. As observed in the charts, the 50-MA and 200-MA are approaching a golden cross, something that may trigger the next significant surge for Bitcoin. Bitcoin’s price recently moved above the 200-MA for the first time since 8 November, with the 200-MA currently acting as support. The bullish narrative has strengthened with each sign, allowing the world’s largest crypto-asset to register a fast start in 2020.
Conclusion
All the signs point towards another breach of $10,000, something that might happen over the next week. However, a correction down to $9300 may solidify Bitcoin’s future growth, rather than collapsing following another flash hike.


