Disclaimer: The findings of the following article are the sole opinion of the writer and should not be considered as investment advice
Bitcoin‘s price movement over the previous week seemed to have formed a curve, one perhaps hinting at a potentially bullish pattern that could push BTC to $11,700. At press time, Bitcoin was trading at $11,432, with the cryptocurrency’s price likely to register a swing lower, followed by a small surge that could lead to the completion of the aforementioned bullish pattern.
Bitcoin 1-hour chart
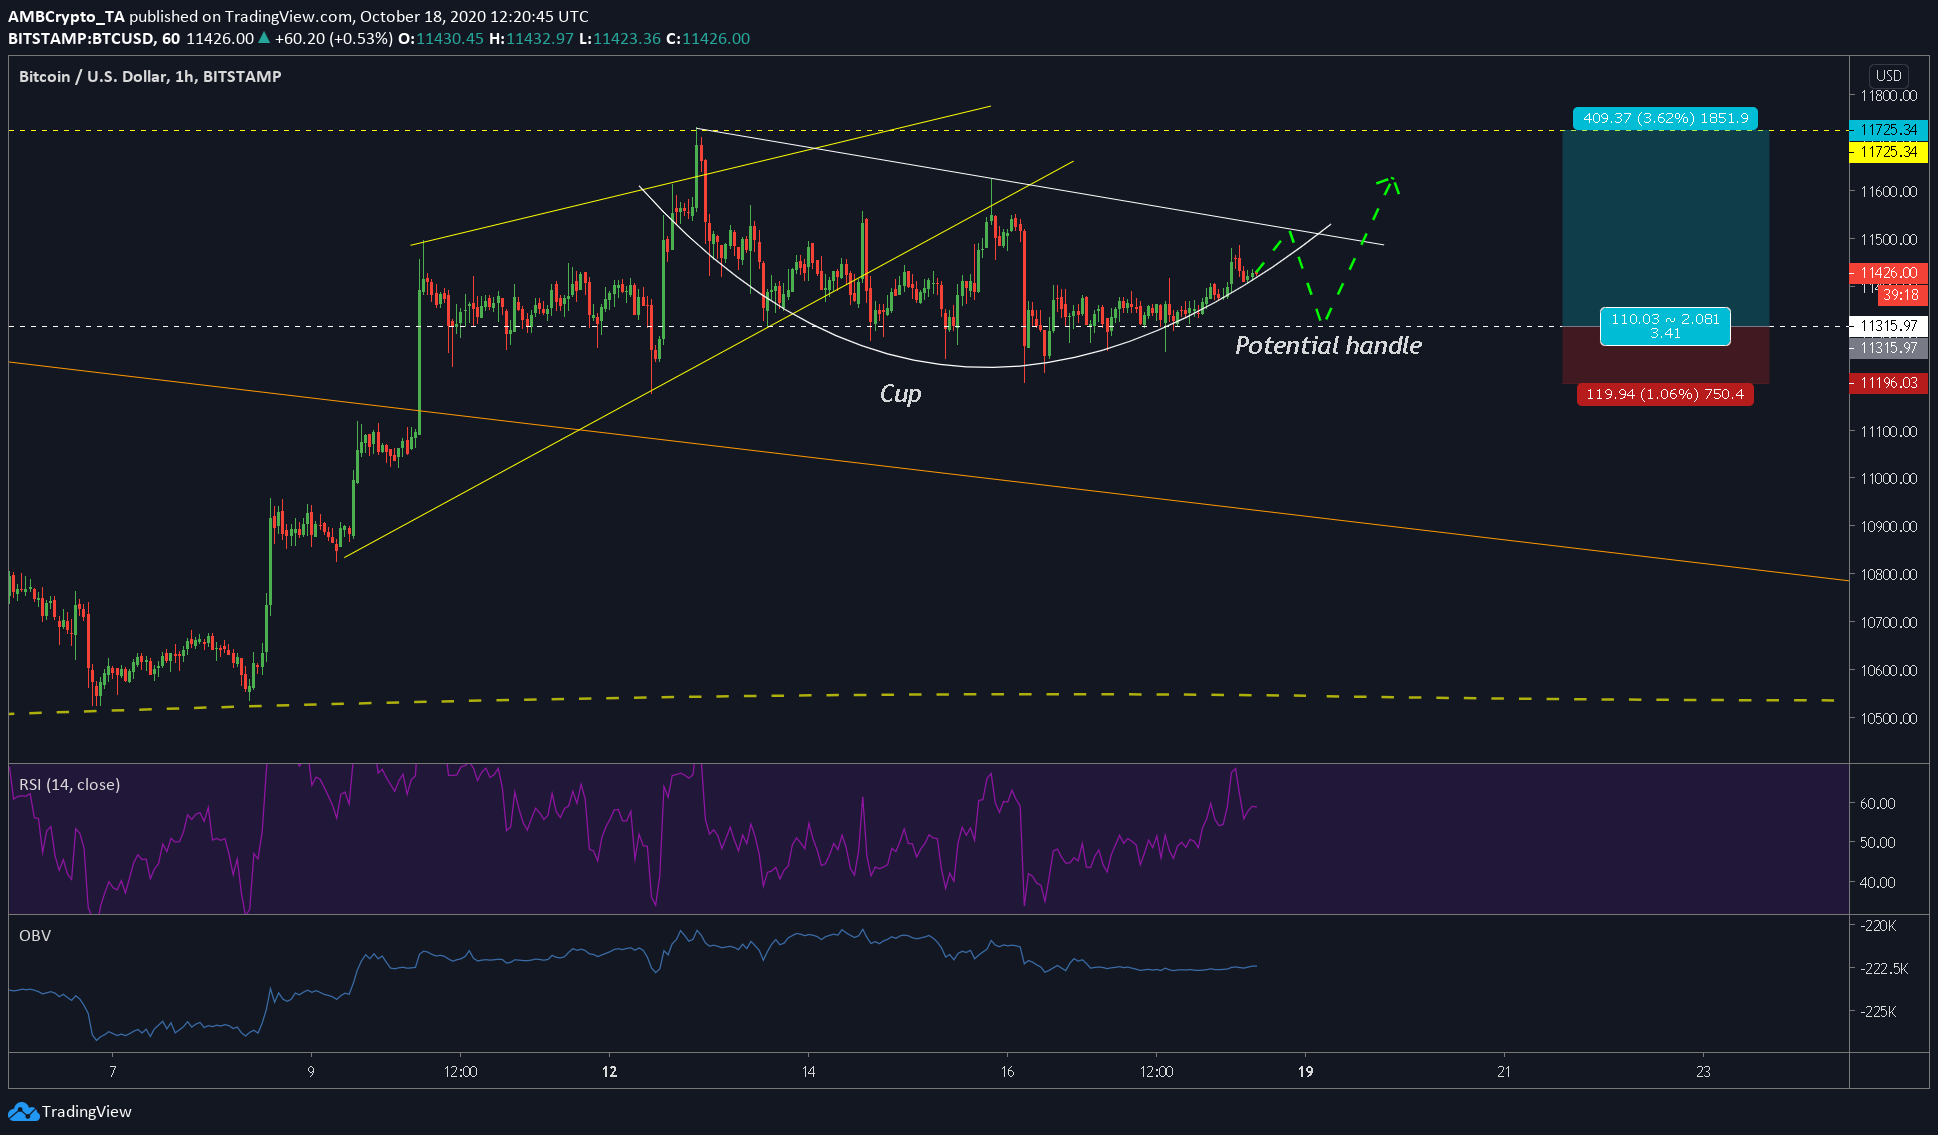
Source: BTCUSD on TradingView
The one-hour chart for Bitcoin pictured a potential cup and handle pattern in the formation or it could be a rounded bottom, at the most. Either way, both patterns lead to a bullish breakout.
The potential rounded bottom or the cup and handle pattern both have necklines or important resistance level that the price needs to breach. This level is shown in the chart as a declined line connecting the tops of the cup or the rounded bottom. At press time, the price was very close to approaching this level. However, it should be noted that the price can proceed from here in two ways,
- Rejection at the declined resistance leading to the formation of the handle
- A successful breakout above the rejection, followed by a retest to begin a small bull rally
As mentioned previously, either way, this is a bullish case for Bitcoin. Hence, longing Bitcoin here would be a great opportunity.
With an entry position at the bottom of the potential handle [$11,315.97], take profit at $11,725.34 and stop-loss at $11,196.03, the trade would yield a risk-to-reward ratio of 3.41R.
The RSI indicator showed a bounce at the overbought level, however, there hadn’t been any breach higher. Hence, we can expect this downtrend in RSI to continue up to the 50-level. This also helps the case of the cup and handle pattern.
The OBV indicator showed a constant, yet slowly rising OBV line, one that was complementary to the slow rise in price in a curve, further strengthening the pump.
All-in-all, Bitcoin’s price seemed healthy and looked due for a small correction in the short-term, and a good surge in the short-to-medium term.