
Disclaimer: The findings of the following article should not be taken as investment advice as it is the sole opinion of the writer
Bitcoin was undergoing corrections, at the time of writing, over the shorter timeframe. After recording significant movement while also briefly re-testing the $11,100-mark, Bitcoin’s bullish momentum on the charts finally seemed to run out. With a press time valuation of $10,813, Bitcoin had a market cap of $199 billion, having registered a minor fall of 0.69 percent over the past 24-hours.
Bitcoin 1-hour chart
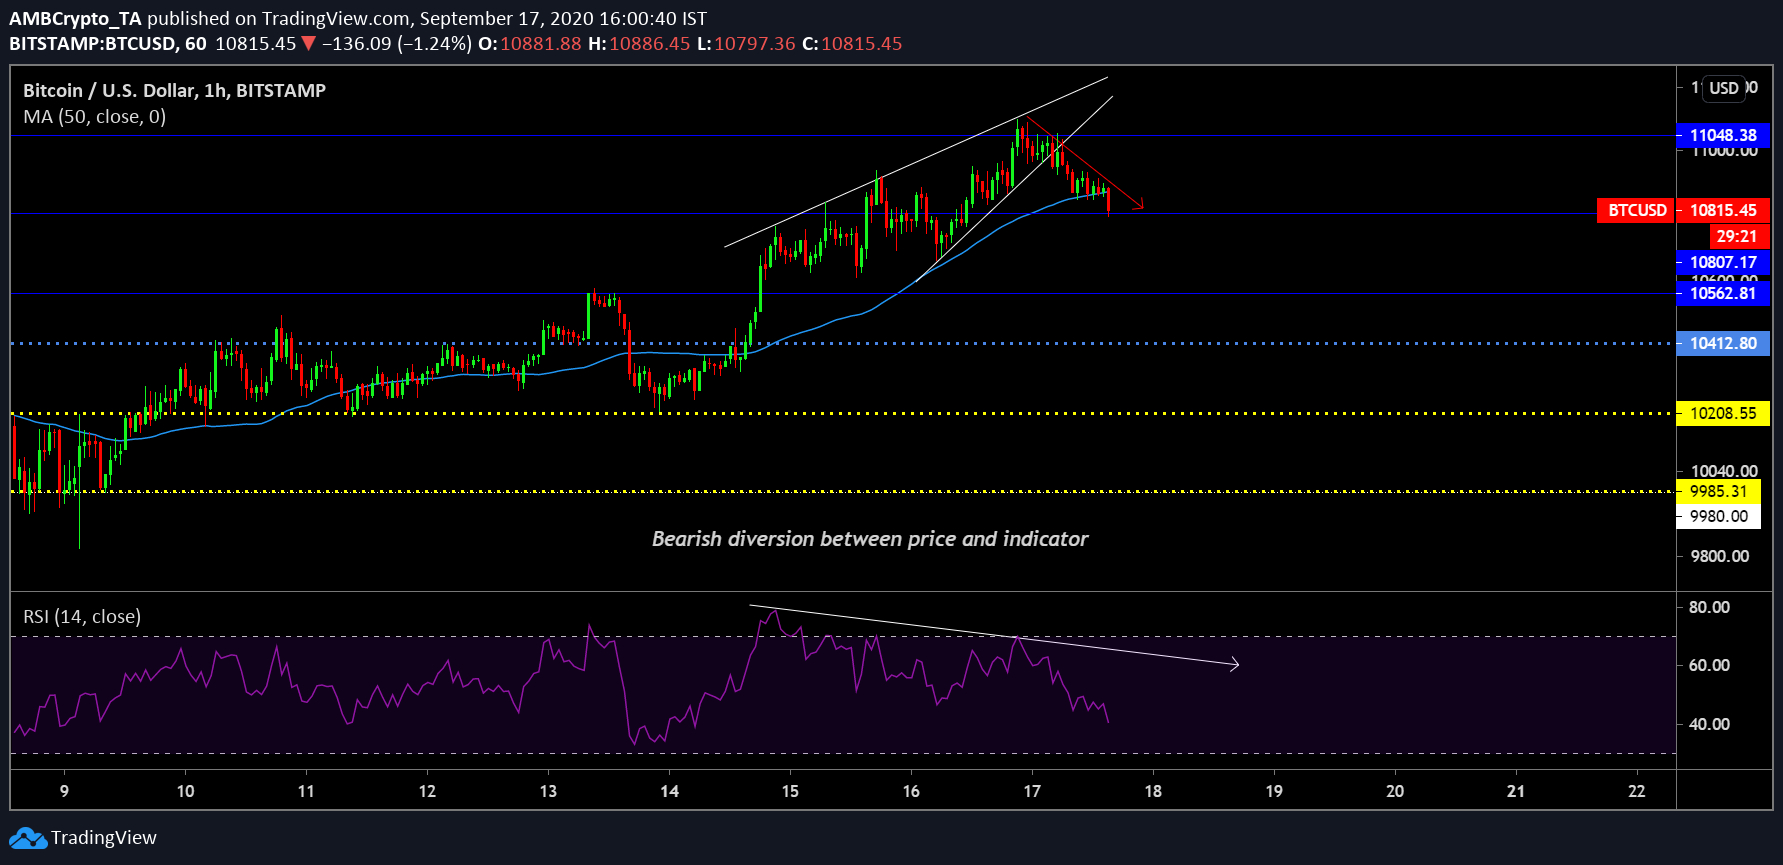
Source: BTC/USD on TradingView
After an impressive run on the 1-hour chart, Bitcoin was finally breaking bearish out the rising wedge pattern. The crypto-asset managed to re-test the resistance at $11,048, but at press time, the valuation had slid below $10,900 again. Over the past few days, most of the fundamentals have been turning against the rising value of Bitcoin, with the bearish diversion between Bitcoin and RSI evident on the chart.
Further, the buying pressure consistently fell over the past 48-hours, while the price continued to climb in the market. However, as the price breached the rising wedge pattern, the 50-Moving Average was slowly flipping to an overhead resistance as well, one that will predominantly increase the selling pressure over the next few hours. The buying momentum from the retail end should be exhausted as Bitcoin’s value heads towards its immediate support.
Bitcoin 30-minute chart

Source: BTC/USD on Trading View
The 30-min chart for Bitcoin clearly underlined the support levels, with respect to the Fibonacci Retracement lines. According to the Fib-retracement, the immediate re-test should be at $10,813, a level where the valuation was placed, at press time.
After a minor pull upwards, the 2nd support was presented at $10,594, while the next one was placed at $10,443. With volatility pulling the strings, sideways movement between these price ranges should be expected, but the trend is also definitely ripe for a shorting position.
Depending on the time and the length of the dip, an entry position can be opened at $10,850 to account for the temporary pullback from the current dip, while the stop losses at $10,945 should be kept. In order to take profits, a higher Risk/Reward Ratio can be achieved by placing a take profit at $10,443, where the R/R ratio is 3.75x. A conservative approach can see short-term gains at $10,594, as well as for an R/R ratio of 2.69x.


