Bitcoin short-term Price Analysis: 13 August

Disclaimer: The findings of the following article should materialize over the next few hours. Also, the following information should not be considered as investment advice
Bitcoin’s decline down to $11,133 on 11 August damaged its consolidation above its previous support line at $11,618. The downtrend was significant, dropping down from a high of $18,410, all the way to $11,130 at one point. While on the 12th of August Bitcoin’s price did test its resistance at $11,618, the crypto-asset dropped down to $11,270 a few hours later.
At the time of writing, Bitcoin was valued at $11,584 with a market cap of $213 billion.
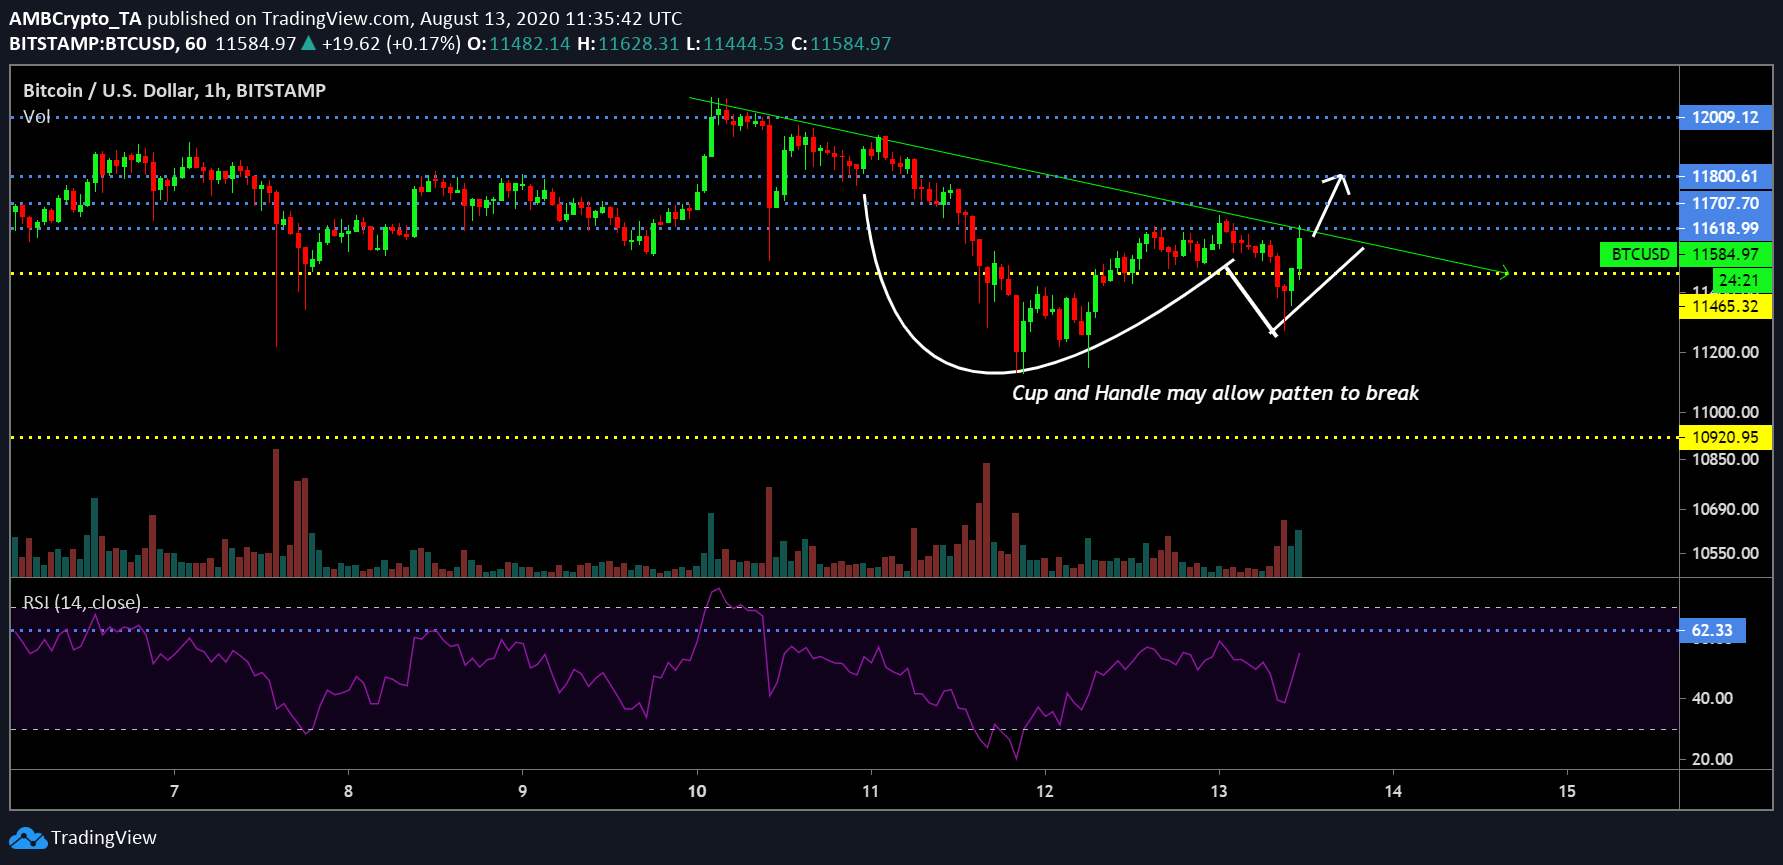
Bitcoin 1-hour chart

Source: BTC/USD on TradingView
As illustrated by the attached chart, Bitcoin, at press time, was on a decline, adhering to the downtrend marked by the green indicator. During its recent slump, the crypto-asset breached past major resistance at $11,800, $11,707, and $11,618, before finally dropping under $11,465 for a brief period.
A few hours before the time of writing, Bitcoin had dropped under $11,465 again, before making it back above within an hour. At press time, the Relative Strength Index or RSI was on a high. Hence, the buying pressure ought to push the price of the cryptocurrency north.
The RSI should allow the Cup and Handle pattern to break as well. If the bullish momentum were to carry through, the C&H pattern will exhibit a bullish break for Bitcoin from the resistance at $11,618, allowing the asset to re-test its resistance at $11,707.
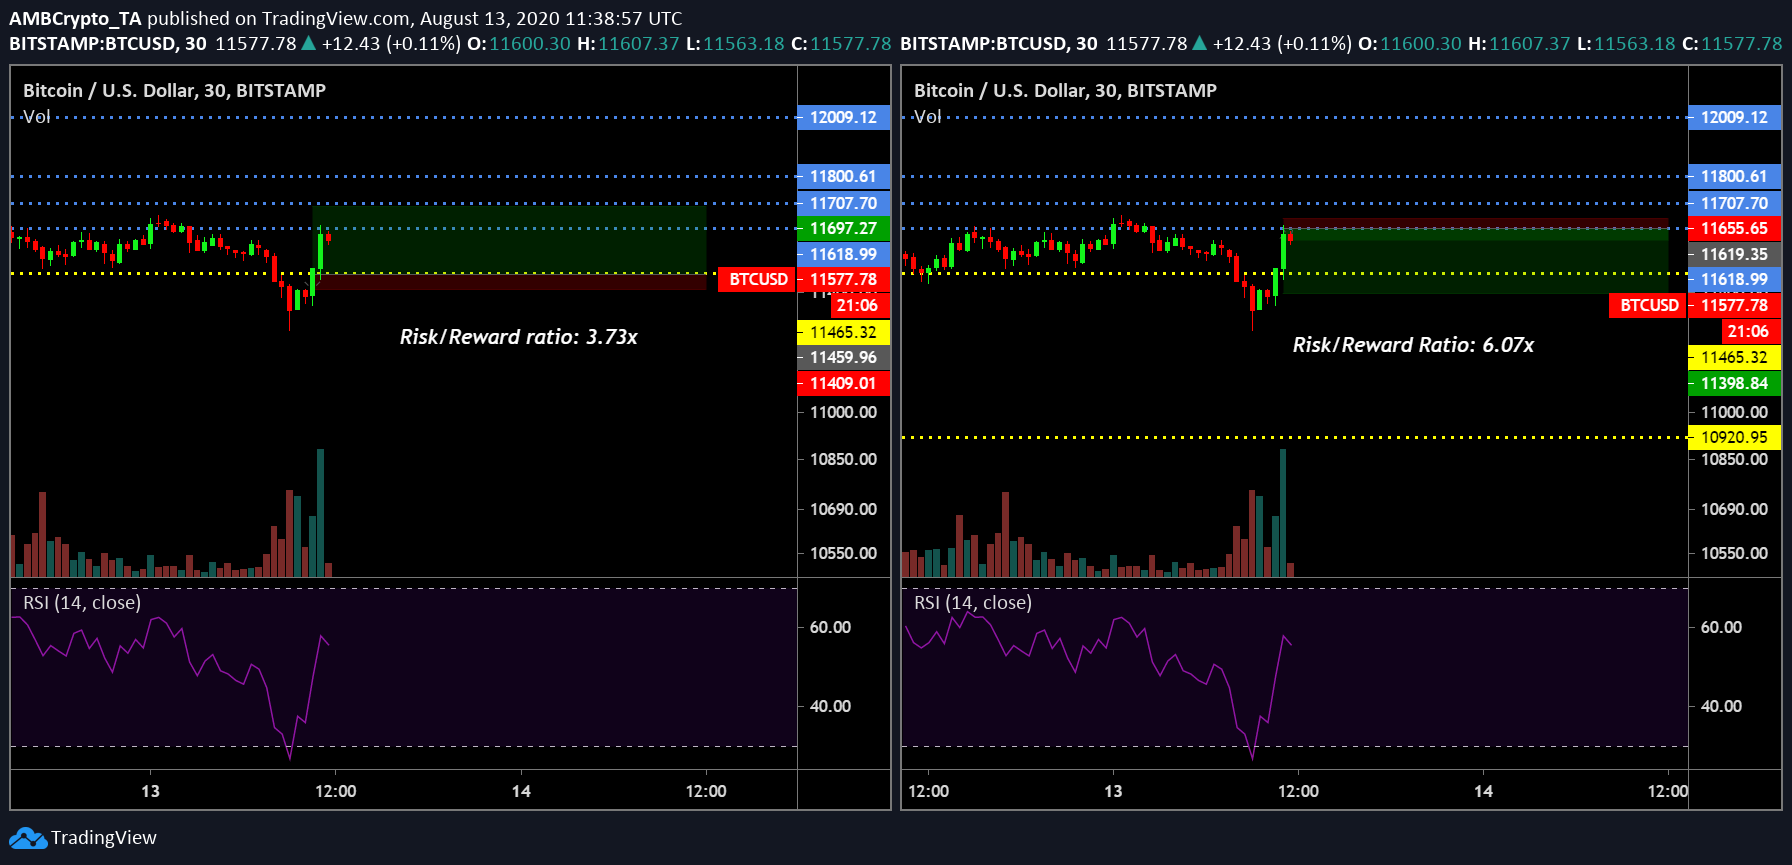
Bitcoin’s 30-min chart

Source: BTC/USD on TradingView
Now, in spite of the bullish condition, the market seemed more inclined towards a profitable short position on the charts. For shorting the price at the moment, entry at $11,619 could be placed with a take profit order at $11,398. The stop loss should be placed at around $11,655 to attain a risk/reward ratio of 6.07x.
For the possible position, the entry would be somewhere around $11,459 and the take profit region would be foreseeable at $11707. However, a stop loss at $11409 seemed imminent, keeping the risk/reward ratio at reduced profitability of 3.73x.
The reason for the shorting position is the reversal of the Relative Strength Index. There is still a chance for a push above the current index point, but it was inclined more towards another re-test at $11,465.


