
Disclaimer: This article attempts to foresee Bitcoin’s price movements leading up to a potential breakout in the first week of July.
Bitcoin has been trading at $9,409, at the time of writing while its dominance dipped to 64.7%. Despite numerous upward attempts it still has failed to come close to reclaiming its 2020-highs. The rally for the world’s largest cryptocurrency appeared to have stalled and a prospect of a bullish breakout did not appear in the charts below.
Bitcoin [BTC] Daily Chart:
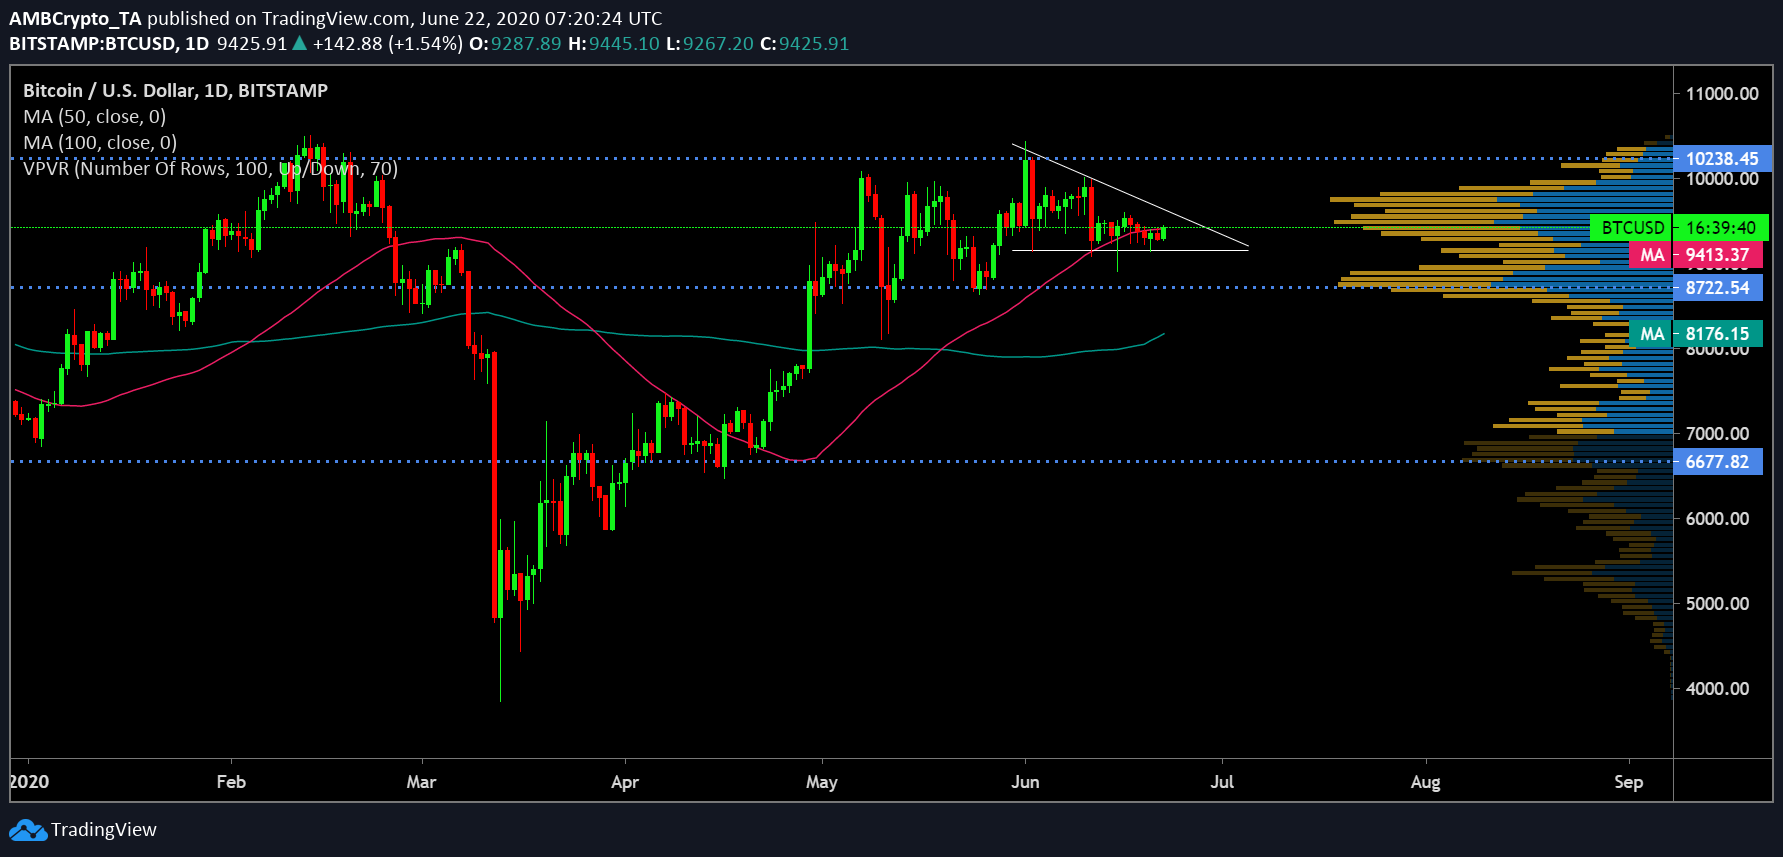
Source: BTC/USD on TradingView
Bitcoin’s price candles were observed to be oscillating between the trendlines of a descending triangle pattern on the daily chart. Completion of this pattern formation was estimated to take place by the end of the first week of July, following which a breakout on the downside was predicted. The presence of bearishness was also exhibited by the placement of the 50 daily moving average. The 50 DMA [Pink] shot back up after it climbed above the 100 DMA in min-May supporting BTC price candles from falling further.
However, this trend changed. The 50 DMA rose above the price candles which was a sign of another market downturn. While the 100 DMA [Blue] continued to rest well below the 50 DMA as well as forming a crucial support for the coin’s price candles, it depicted a notable uptick at the time of writing which could be an indication of a target to cross the 50 DMA if Bitcoin undergoes another downside correction.
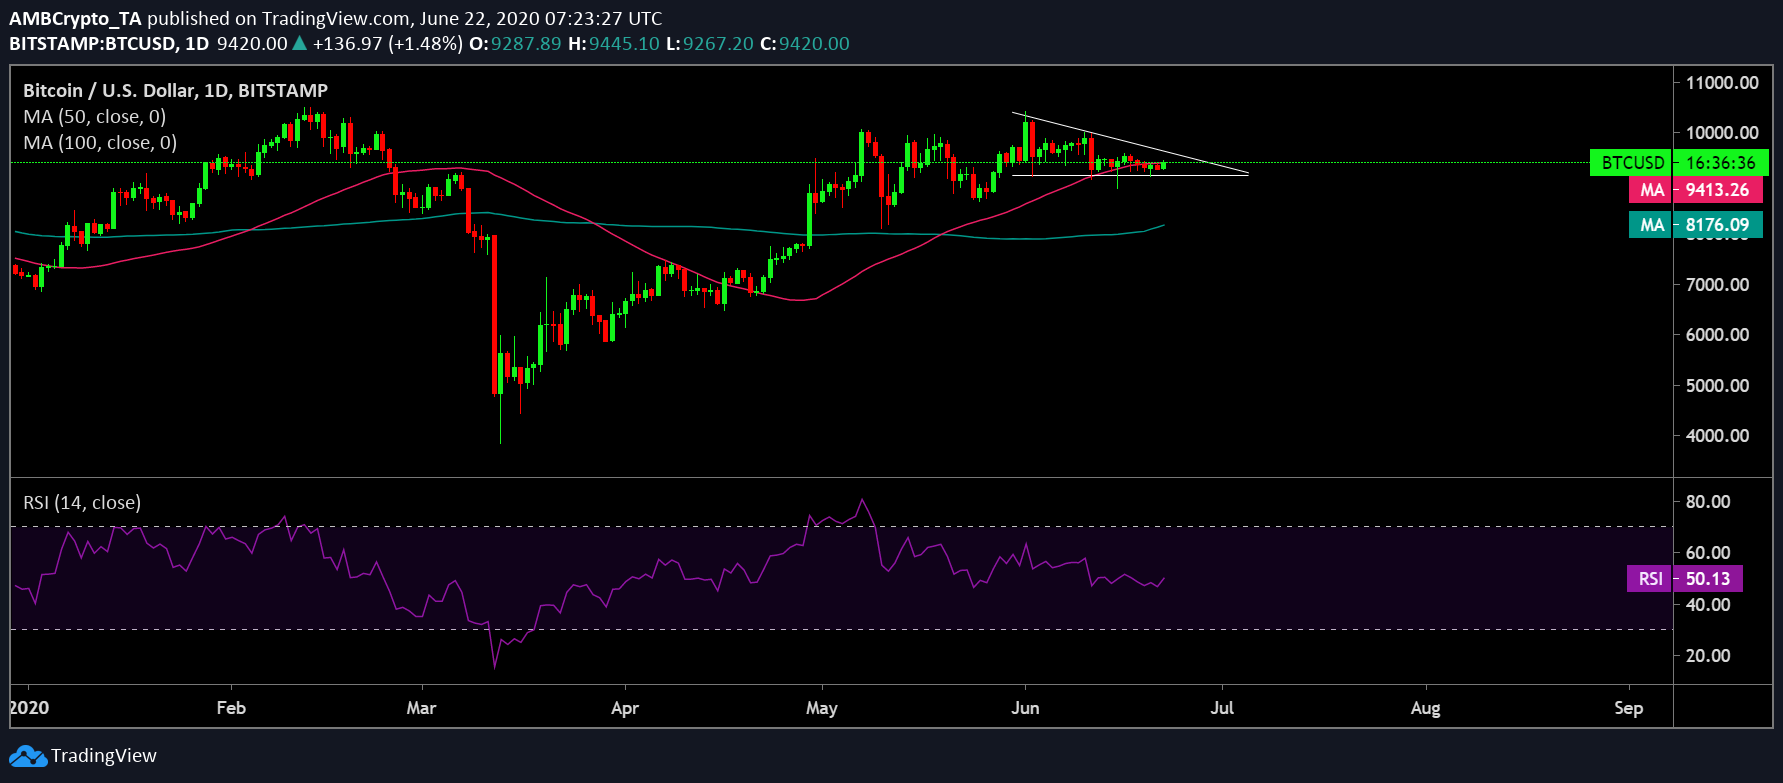
Source: BTC/USD on TradingView
The RSI has closely mimicked the coin’s price movements. and was, currently, hovering close to the 50-median line exhibiting the presence of a sentiment of buying pressure among the investors in the market. Before the completion of the pattern formation, the coin might undergo a minor surge and a subsequent pullback between the two trendlines.
A potential bearish breakout in the first week of July would lead the coin’s value to retest $8722, a level depicted by the VPVR indicator with high trading activity. If the bears achieve the necessary momentum Bitcoin could potentially breach the said level and retrace close to the support level of the 100 DMA at $8176. Another support for Bitcoin stood untested since the last week of May at $6677 while the price candles were resisted at points 50 DMA close to $9,500 and $10,238 respectively.